News
Tesla and SpaceX Merger: What It Could Mean for Investors and Stock Prices
22 Oct 2026, 10:30


Join Minipip Academy and access free courses in investing, trading, economics, and more.
Sign Up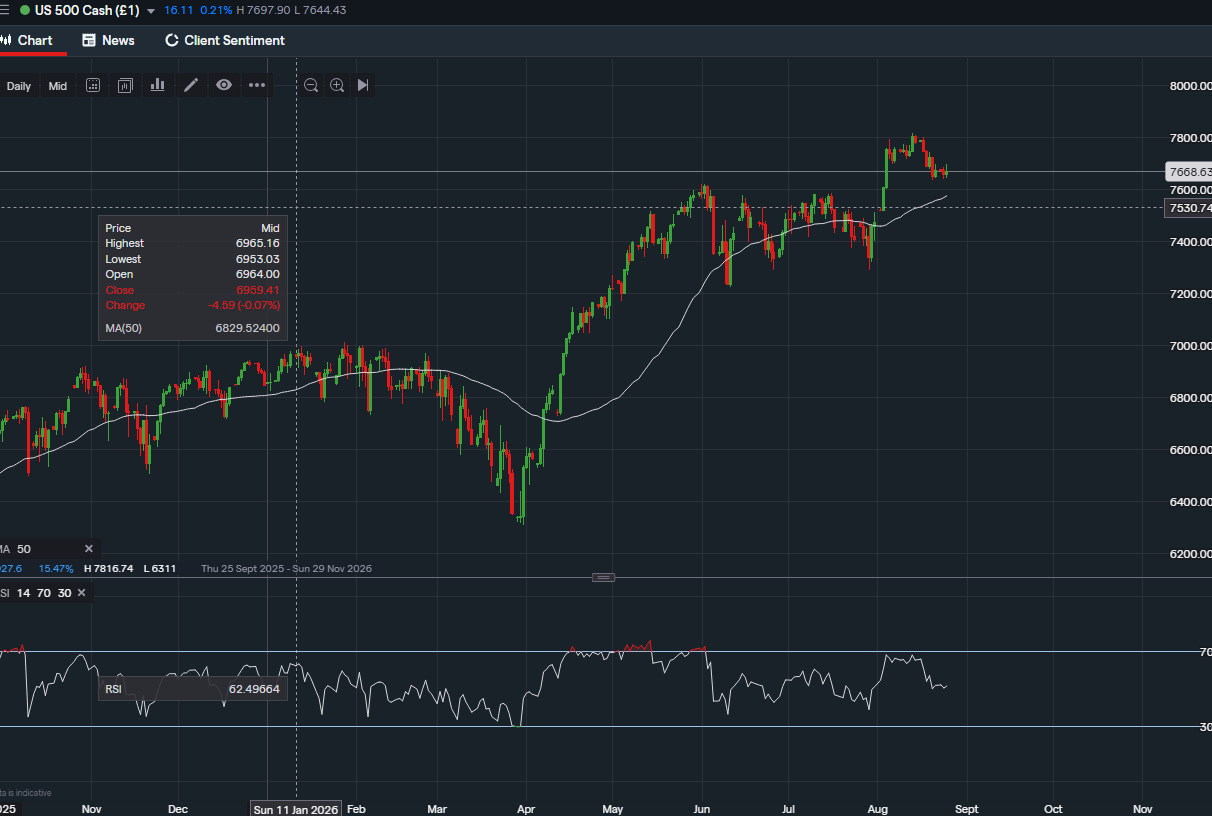
S&P 500: How Much of This Rally Is Real Profit?


The S&P 500's record earnings rest partly on a guess: how long does a data-centre server actually last?
Stretch the number and depreciation shrinks - profits look bigger. Microsoft and Google both made that call in 2023, extending server life from four years to six; combined, it added roughly $6 billion to net income. Meta followed in 2025, adding about $2.9 billion - nearly 4% of its pre-tax profit.
Scale that up: the five biggest AI spenders (Alphabet, Amazon, Meta, Microsoft, Oracle) will spend around $760 billion on AI infrastructure in 2026 but recognise only about $211 billion of it as depreciation this year. Their combined net income is projected to rise 25%, while free cash flow falls 91%.
Because these firms dominate the index, that accounting choice ripples into the S&P 500's own numbers - strip AI infrastructure out, and the other ~470 constituents actually saw 2026 earnings estimates revised down. It's a genuine, if under-discussed, backdrop to the valuation and technical picture below.
The index closed at 7,652.86 on 24 August, down 0.28% on the day and roughly 2% off its mid-August record of 7,816.70, after a chip-stock selloff (AMD -10%, Micron -10%, Nvidia -2%) rattled sentiment. The 52-week range is 6,316.91–7,816.70.
Trailing P/E sits at ~26.0 — slightly above its long-term average of 25.4, but within the normal 21–29 range. Some of that apparent "cheapness" reflects depreciation timing rather than cash profit (see above). Technology alone is 36.2% of the index, so mega-cap tech sentiment drives the multiple more than any single "average" constituent.
Wall Street's 2026 year-end targets range widely, averaging roughly 10% upside for the year.
*Versus the 22 December 2025 close of 6,878.49.
Fed decision (15–16 Sept): rates held at 3.50%–3.75% in July; opinion is split between a cut and a hike given inflation (3.5% in June, up-risk from tariffs and energy costs). Likely the biggest swing factor into Q4.
AI capex/chip selloff: concerns over AI infrastructure ROI, memory-chip competition and China's semiconductor build-out. With tech at 36.2% of the index, this sector remains the key swing factor for the S&P 500 itself.
The chart at the top of this note shows a strong, intact uptrend: from the ~6,311 low reached in spring, the index rallied hard into a record high near 7,816–7,900 in mid-August, and has spent the past few weeks consolidating that move rather than reversing it. Price is still comfortably above its rising 50-day moving average (currently tracking in the low-7,500s), which keeps the medium-term trend structurally intact even after the recent pullback.
RSI(14) tells the same story from a momentum angle. It pushed above 70 - genuinely overbought - through the June-August rally, then rolled over sharply into the low-30s as price pulled back from the record high. It has since recovered back into the 60s, well clear of oversold levels but no longer flashing the overbought extreme seen at the peak. That's a healthy reset rather than a breakdown: momentum cooled from an unsustainable pace without collapsing.
Support: the rising 50-day average (~7,500) and the prior breakout base around 7,400–7,500 - a close back below that zone would be the first real sign the uptrend is in trouble. Resistance: the recent swing highs around 7,700–7,750, then the 7,816–7,900 record zone above that. A clean push through 7,750 would put the highs back in play; failure there keeps the index range-bound just under its record.
The bigger trend looks intact - price holds above its rising 50-day average and Street targets still imply ~10% further upside for 2026 - but the index is consolidating just under its record high, valuation sits slightly above its norm (partly flattered by depreciation accounting), and a genuinely uncertain Fed decision on 16 September sits directly ahead. Watch the 7,400–7,500 support zone and 7,750 resistance for the next directional signal.
This analysis is for educational and informational purposes only and does not constitute financial advice. Data as of 25 August 2026 — always conduct your own research before making investment decisions.

Tradable assets:
Min.Deposit:
Max Leverage:
FCA:

Rating:
 Earnings Calendar
  Economic Calendar
  VAT Calculator
  Tax Free Childcare Calculator
 Percentage Calculator
 Compound Interest Calculator
  Loan Overpayment Calculator
 Mortgage Calculator
 Credit Card Calculator
 Investing
  Economics
 Trading
  Technical Analysis
  Personal Finance
 Calculator