News
Tesla Q3 Update and Its Impact on the Stock
04 Oct 2026, 10:00


Join Minipip Academy and access free courses in investing, trading, economics, and more.
Sign Up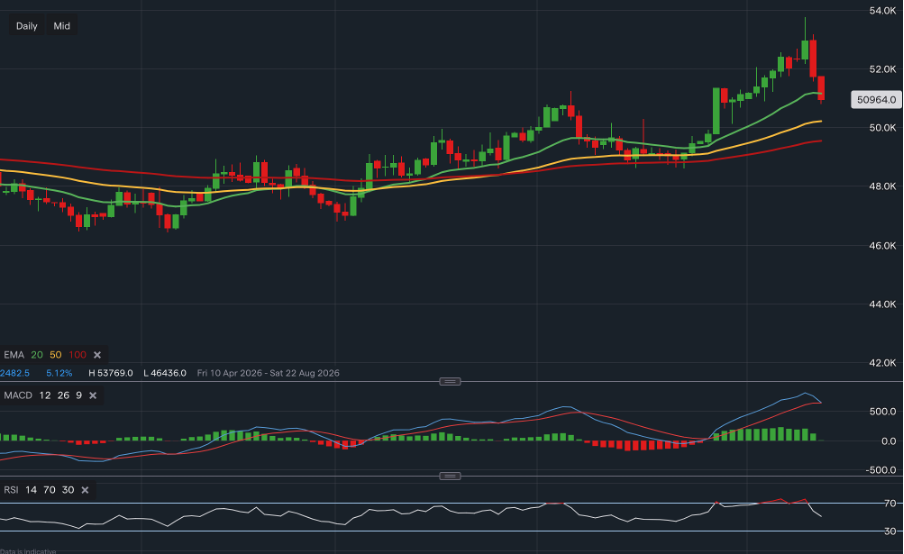
Technically, Berkshire’s broader uptrend remains intact, but neutral RSI, slowing MACD momentum and below-average volume suggest traders should watch for stronger confirmation before a renewed move higher.


Berkshire Hathaway is one of the world’s largest listed companies, with a market capitalisation of $989.71bn. Market capitalisation measures the value investors currently place on the company’s equity, while Enterprise Value (EV) adjusts this for factors including debt and cash. Berkshire’s lower EV of $755.84bn reflects, in part, its substantial cash position and highlights the financial strength behind the group’s operating businesses.
The company generated $384.69bn in revenue and $85.77bn in net income on a trailing basis. Earnings Per Share (EPS), which measures the profit attributable to each share, stands at $39.77. However, next year’s forecast EPS falls to $21.97, pointing towards substantially weaker reported earnings if analyst expectations are realised.
Berkshire Hathaway’s valuation presents a mixed picture, with trailing earnings suggesting a relatively modest valuation but forward earnings and cash-flow measures appearing more expensive.
The current Price-to-Earnings Ratio (P/E) of 12.82x is above the industry average of 9.96x, but below Berkshire’s historical median of 15.45x, suggesting the shares are relatively expensive against industry peers but cheaper than their typical historical valuation. The Price/Earnings-to-Growth Ratio (PEG) of 6.86x, substantially above the 0.23x industry average, and Price-to-Free-Cash-Flow Ratio (P/FCF) of 40.87x also indicate a relatively high valuation against expected growth and free cash generation. Enterprise Value-to-Earnings Before Interest, Tax, Depreciation and Amortisation (EV/EBITDA) compares the total value of the business with its underlying operating earnings. Berkshire’s 9.88x multiple versus an industry average of 6.89x represents a roughly 43% premium, reinforcing the view that Berkshire commands a higher valuation than its industry despite trading below its own historical P/E range.
The Price-to-Book Ratio (P/B) of 1.46x, below the sector average of 1.74x, means Berkshire trades at 1.46 times its accounting book value and appears relatively inexpensive on an asset basis. This is particularly relevant for Berkshire given its insurance operations, investments and wholly owned businesses, making book value a useful supplementary measure alongside earnings.
By contrast, the Price-to-Sales Ratio (P/S) of 2.57x is above the sector average of 2.27x, indicating investors pay a modest premium for each dollar of Berkshire’s revenue. Enterprise Value-to-Sales (EV/Sales) of 1.96x provides a broader measure of the value placed on sales after accounting for debt and cash, while Cash per Share of $188.26 highlights Berkshire’s substantial liquidity. Overall, Berkshire appears relatively attractive on book value but carries a modest premium on sales, reinforcing the mixed valuation picture.
Berkshire’s balance sheet provides an important measure of its ability to withstand weaker economic or market conditions while retaining capital for investment. The Debt-to-Equity Ratio (Debt/Eq) of 0.17x indicates relatively low debt compared with shareholders’ equity and sits slightly below the industry average of 0.20x, suggesting Berkshire uses marginally less leverage than its peers. This supports financial flexibility and reduces reliance on debt financing.
Analyst Consensus & Market Expectations
Analyst coverage is limited but currently positive. Two analyst ratings issued over the past three months both rate Berkshire Hathaway a Strong Buy, with no Hold or Sell recommendations.
The $604 price target implies 18.45% upside from the reference share price. However, with only two recent ratings and identical high, low and average targets, the consensus should be treated as a supporting indicator rather than strong evidence of future price direction.
Key Catalysts & Risks
Berkshire’s diversified operations across insurance, energy, utilities, railways, manufacturing, services and retail reduce its dependence on any single industry, while a Debt/Eq ratio of 0.17x and substantial cash generation provide financial flexibility for investment, acquisitions and share repurchases. However, reported earnings can fluctuate considerably due to insurance performance and movements in its investment portfolio, potentially distorting Earnings Per Share (EPS) and valuation measures. Cash generation may also diverge from reported profits, while underwriting cycles, catastrophe losses, equity markets and interest rates remain important risks to earnings and the wider fundamental outlook.
Technical Analysis
Price & Trend
Berkshire is trading at $509.51 at time of writing, slightly below its 20-day Exponential Moving Average (EMA) of 51,164.57, but above the 50-day EMA of 50,222.28 and 100-day EMA of 49,553.44. This suggests short-term momentum has softened while the broader trend remains upward. The Directional Movement Index (DMI) supports this, with positive directional movement (+DI) at 31.13, well above negative directional movement (-DI) at 17.96, indicating buyers remain dominant. An Average Directional Index (ADX) of 43.10 indicates that the prevailing trend is relatively strong.
Momentum
Momentum is broadly neutral but retains a slight bullish bias. The Relative Strength Index (RSI) of 50.90 sits close to its midpoint, indicating neither overbought nor oversold conditions and leaving room for movement in either direction. The Moving Average Convergence Divergence (MACD) of 641.82 remains marginally above its 636.53 signal line, producing a positive histogram of 5.18. This suggests bullish momentum remains intact, but the narrow gap indicates that momentum is currently weak rather than accelerating.
Volatility & Trading Range
Berkshire is trading within its Bollinger Bands of 48,496.39 to 53,378.56, with price near the middle of the range rather than either volatility extreme, offering no immediate mean-reversion signal. The Average True Range (ATR) of $8.51 indicates the stock’s typical recent daily price movement, while volatility readings of 1.92% and 1.54% suggest relatively contained price fluctuations. The shares are also 5.20% below their 52-week high of $537.74 and 9.86% above their 52-week low of $464.01, placing price in the upper half of its annual range while leaving room for a retest of previous highs.
Volume & Market Activity
Trading activity is relatively subdued, with current volume of 2.98m shares below the 4.85m average, suggesting weaker market participation and limiting confirmation of the current price trend.
Conclusion
For traders, Berkshire presents a constructive but not unequivocally bullish fundamental picture. Its scale, profitability, diversified business model, strong asset base, low leverage and limited short positioning support the longer-term outlook, while the current trailing valuation also appears favourable relative to its historical range. Against this, weaker forecast Earnings Per Share (EPS), elevated growth and cash-flow multiples, earnings volatility and softer cash conversion temper the signal. Current trading volume is also below average, suggesting that any renewed move higher would benefit from stronger participation. Overall, the fundamentals support maintaining a positive bias, but this should be confirmed through relative strength, momentum and developing price action before identifying a buy-side swing or position trade.
Educational Disclaimer
This content is for educational and informational purposes only and should not be considered financial advice. Always conduct independent research or consult a qualified financial professional before making investment decisions.

Tradable assets:
Min.Deposit:
Max Leverage:
FCA:

Rating:
 Earnings Calendar
  Economic Calendar
  VAT Calculator
  Tax Free Childcare Calculator
 Percentage Calculator
 Compound Interest Calculator
  Loan Overpayment Calculator
 Mortgage Calculator
 Credit Card Calculator
 Investing
  Economics
 Trading
  Technical Analysis
  Personal Finance
 Calculator