Analysis
Amazon Stock Technical Analysis: AMZN Price Targets, Support and Resistance
$251.31
02 Oct 2026, 14:36
Neutral


Join Minipip Academy and access free courses in investing, trading, economics, and more.
Sign Up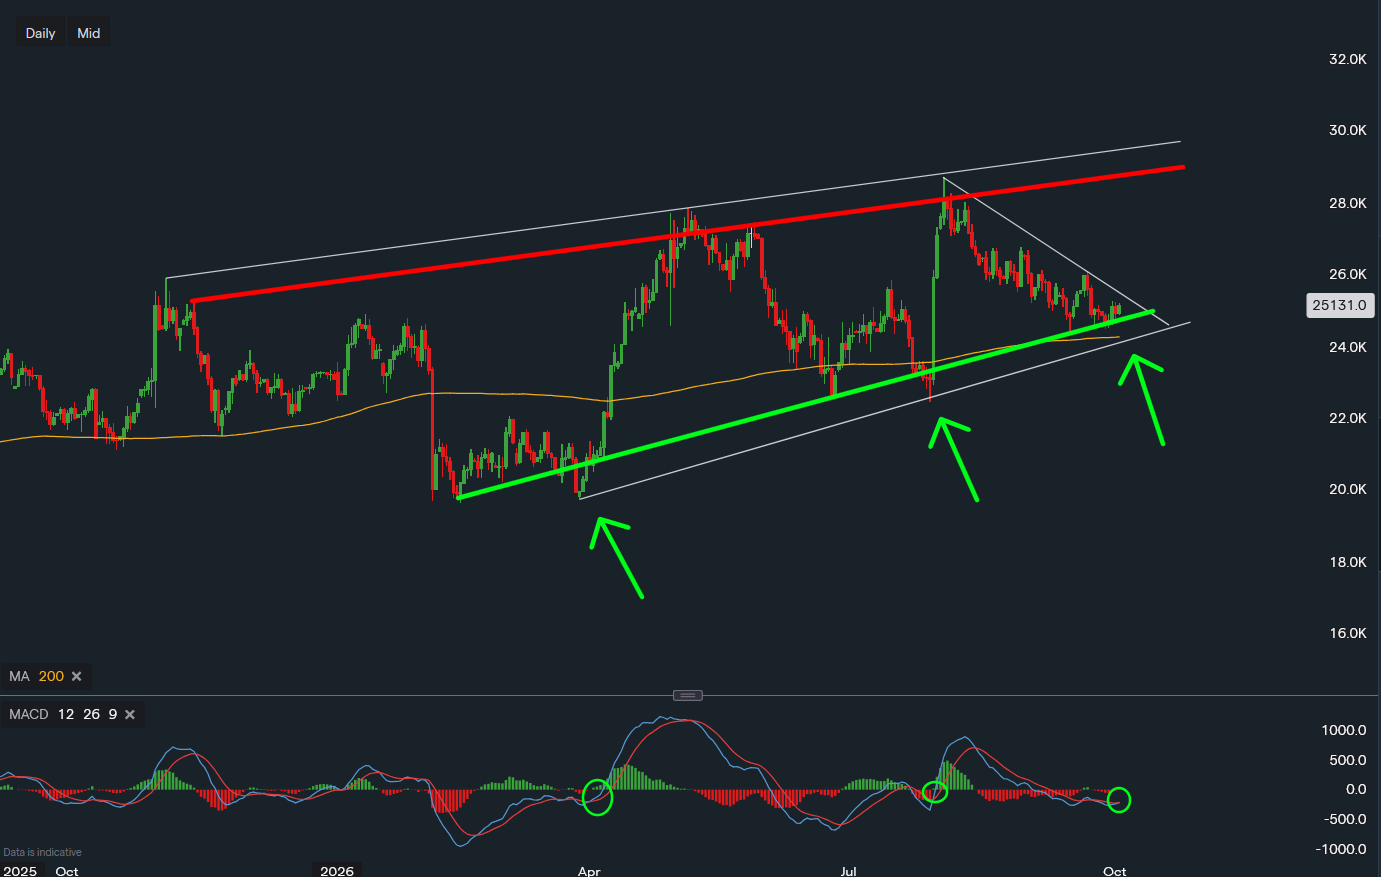
Chart & Data from IG


Taking a look at Amazon (NASDAQ: AMZN) on the daily chart, we can see that the share price has approached the lower end of a rising trading channel that dates back to March 30, when Amazon bottomed. Since then, the stock has been forming a series of higher highs and higher lows, maintaining an overall upward trend.
Technically, the price had almost entered a key demand zone, but buyers have started stepping in more aggressively, helping to keep AMZN above its 200-day moving average. A potential double-bottom pattern also appears to have formed over the past three weeks, which could provide some short-term support and increase the possibility of a reversal.
The setup could give Amazon stock an opportunity to break out of the recent downward move that began on August 3. A break above the white resistance trendline would potentially open the door to a move back towards $260.
If bulls can push the price above that level, the next targets to watch would be $267, followed by an attempt to reclaim the $280 level heading into year-end.
On the downside, a break below the current double-bottom support would increase the risk of a retest of the 200-day moving average, which is currently around $242.50.
A decisive break below the 200-day moving average could trigger further selling pressure and potentially lead to a sharper decline towards the $224–$225 area.
Looking at the MACD (Moving Average Convergence Divergence), which is a widely used momentum indicator, the bias appears to be starting to shift in favour of the bulls. The MACD is currently on the verge of crossing above its signal line, which could indicate that bearish momentum is beginning to weaken and that a potential bullish reversal may be developing.
Interestingly, similar MACD setups occurred in April and again towards the end of July. On both occasions, Amazon stock subsequently rallied towards a new higher high.
For now, traders will be watching whether AMZN can hold the double-bottom support and remain above its 200-day moving average. A move above the descending resistance trendline could strengthen the bullish setup, while a break below the key support levels would invalidate much of the near-term bullish structure.
Key AMZN levels to watch:
This article is for educational and informational purposes only and should not be considered financial advice. Please conduct your own research and/or consult a qualified financial adviser before making any trading or investment decisions.

Tradable assets:
Min.Deposit:
Max Leverage:
FCA:

Rating:
 Earnings Calendar
  Economic Calendar
  VAT Calculator
  Tax Free Childcare Calculator
 Percentage Calculator
 Compound Interest Calculator
  Loan Overpayment Calculator
 Mortgage Calculator
 Credit Card Calculator
 Investing
  Economics
 Trading
  Technical Analysis
  Personal Finance
 Calculator