Analysis
Amazon Stock Technical Analysis: AMZN Price Targets, Support and Resistance
$251.31
02 Oct 2026, 14:36
Neutral


Join Minipip Academy and access free courses in investing, trading, economics, and more.
Sign Up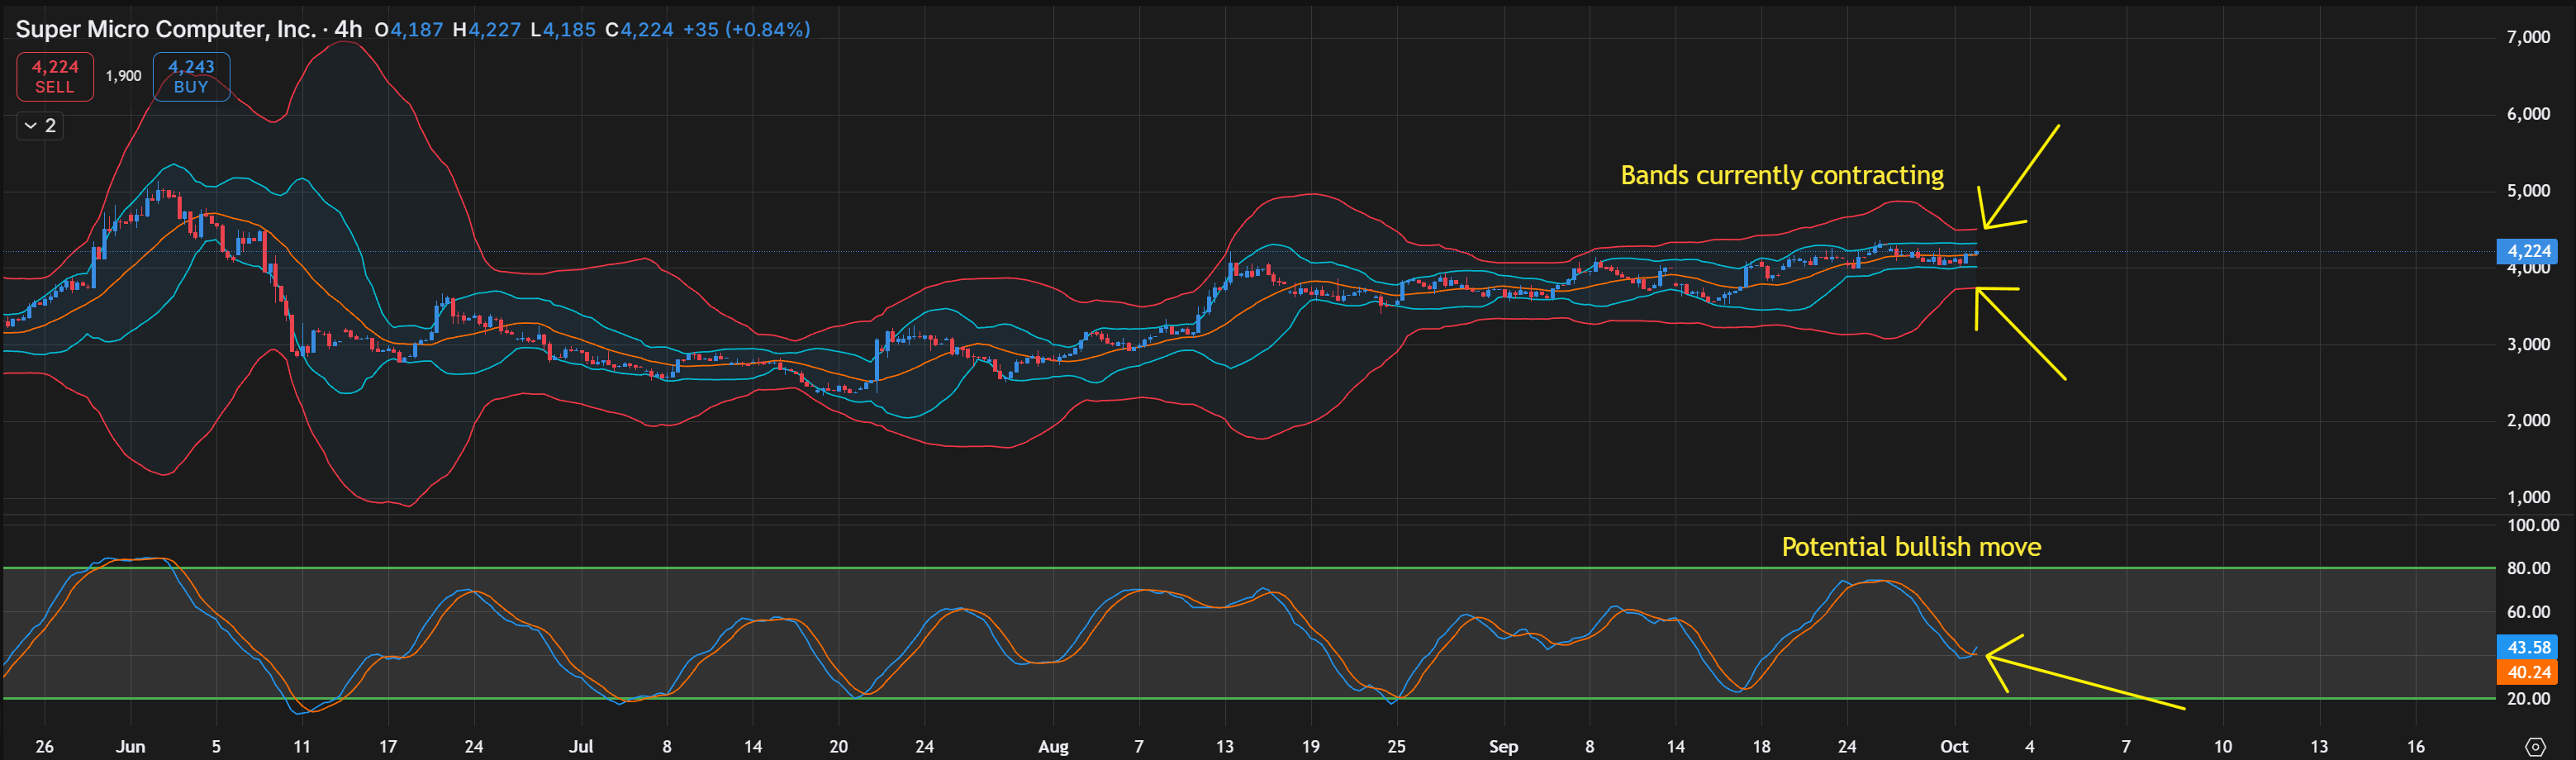
Capital Data - 4H


Super Micro Computer (SMCI) is entering an interesting phase on the four-hour chart, with price action becoming increasingly compressed while momentum begins to show signs of improvement. TipRanks currently shows a rating of 16, with the majority of analysts maintaining a Hold view, while two analysts are positioned on Buy and three on Sell.
This cautious analyst positioning highlights the uncertainty surrounding SMCI, particularly after the stock's previous periods of elevated volatility. Rather than providing a clear directional signal, the current consensus suggests that investors remain divided over the company's near- and longer-term prospects.
SMCI Valuation Leaves Room for Long Term Potential
From a Finviz perspective, SMCI currently trades on a P/E ratio of 12.85, while its forward P/E stands at 7.90. The considerable difference between the two figures suggests that analysts are expecting earnings to increase, which could make the current valuation more attractive if those expectations are ultimately achieved.
For longer-term investors, this provides an interesting backdrop. A lower forward P/E does not automatically mean that the stock is undervalued, as future earnings expectations still need to materialise. However, if Super Micro can continue benefiting from demand for AI infrastructure and translate that demand into stronger earnings, the current valuation could leave room for further investor interest.
SMCI Bollinger Bands Show Growing Compression
Turning to the four-hour chart, the two sets of Bollinger Bands are currently contracting, with both the upper and lower bands moving closer together around price. This indicates that volatility has been declining as SMCI enters a mild consolidative phase.
The contraction is particularly noteworthy because periods of narrowing Bollinger Bands can precede a larger expansion in volatility. The bands themselves do not determine the eventual direction, but they indicate that pressure is building as price becomes increasingly compressed within the current range.
Four Hour Consolidation Could Set the Stage for a Breakout
Price action is currently holding around the $4,200 area, with SMCI trading within a relatively tight range. The stock has avoided a significant breakdown while gradually maintaining its position around the middle-to-upper portion of the recent consolidation.
This creates an important technical area to monitor. A decisive move above the current range and towards the upper Bollinger Band could signal that buyers are beginning to take control, particularly if the move is accompanied by expanding volatility. On the other hand, a breakdown through the lower Bollinger Band would weaken the developing bullish setup and suggest that sellers are regaining momentum.
Stochastic Crossover Provides an Early Bullish Signal
The stochastic oscillator is also beginning to support the potential for an upside move. On the four-hour timeframe, the %K line has crossed bullishly above the %D line, with the stochastic currently sitting around 43.58 for %K and 40.24 for %D.
The crossover suggests that short-term momentum is beginning to recover following the recent decline. Another positive aspect is that the stochastic remains comfortably below the 80 overbought area, meaning the indicator has not yet entered an extreme zone where upside momentum could appear overstretched.
However, the crossover should still be treated as an early momentum signal rather than confirmation of a breakout. Continued separation between the %K and %D lines, combined with rising price action, would provide greater confirmation that momentum is genuinely shifting in favour of buyers.
SMCI Technical Setup Builds Towards a Key Decision
The combination of contracting Bollinger Bands and a bullish stochastic crossover makes the current four-hour setup particularly interesting. The Bollinger Bands indicate that volatility is being compressed, while the stochastic suggests that short-term momentum is beginning to turn higher.
If buyers can push SMCI through the upper boundary of the current consolidation while the Bollinger Bands begin expanding, this could provide stronger evidence that the compression is resolving to the upside. Conversely, a move through the lower band would invalidate much of the developing bullish momentum and place greater focus on downside support.
SMCI Outlook: Confirmation Remains the Key
Overall, Super Micro Computer is approaching a potentially important technical juncture on the four-hour timeframe. The fundamental backdrop provides an interesting valuation case, with the forward P/E significantly below the current trailing P/E, while the technical picture shows a period of consolidation, contracting Bollinger Bands and an early bullish stochastic crossover.
For now, the chart points towards potential rather than confirmation. The next expansion in volatility should provide greater clarity on SMCI's direction, with traders likely to monitor the current consolidation range closely for a sustained breakout or breakdown.
Disclaimer
This analysis is for informational purposes only and should not be considered financial advice. Investors and traders should conduct their own research and consider individual risk tolerance before making any investment decisions.

Tradable assets:
Min.Deposit:
Max Leverage:
FCA:

Rating:
 Earnings Calendar
  Economic Calendar
  VAT Calculator
  Tax Free Childcare Calculator
 Percentage Calculator
 Compound Interest Calculator
  Loan Overpayment Calculator
 Mortgage Calculator
 Credit Card Calculator
 Investing
  Economics
 Trading
  Technical Analysis
  Personal Finance
 Calculator