Analysis
Broadcom Holds Long Term Support as Two Trend Lines Close In
$353
28 Sep 2026, 13:00
Neutral


Join Minipip Academy and access free courses in investing, trading, economics, and more.
Sign Up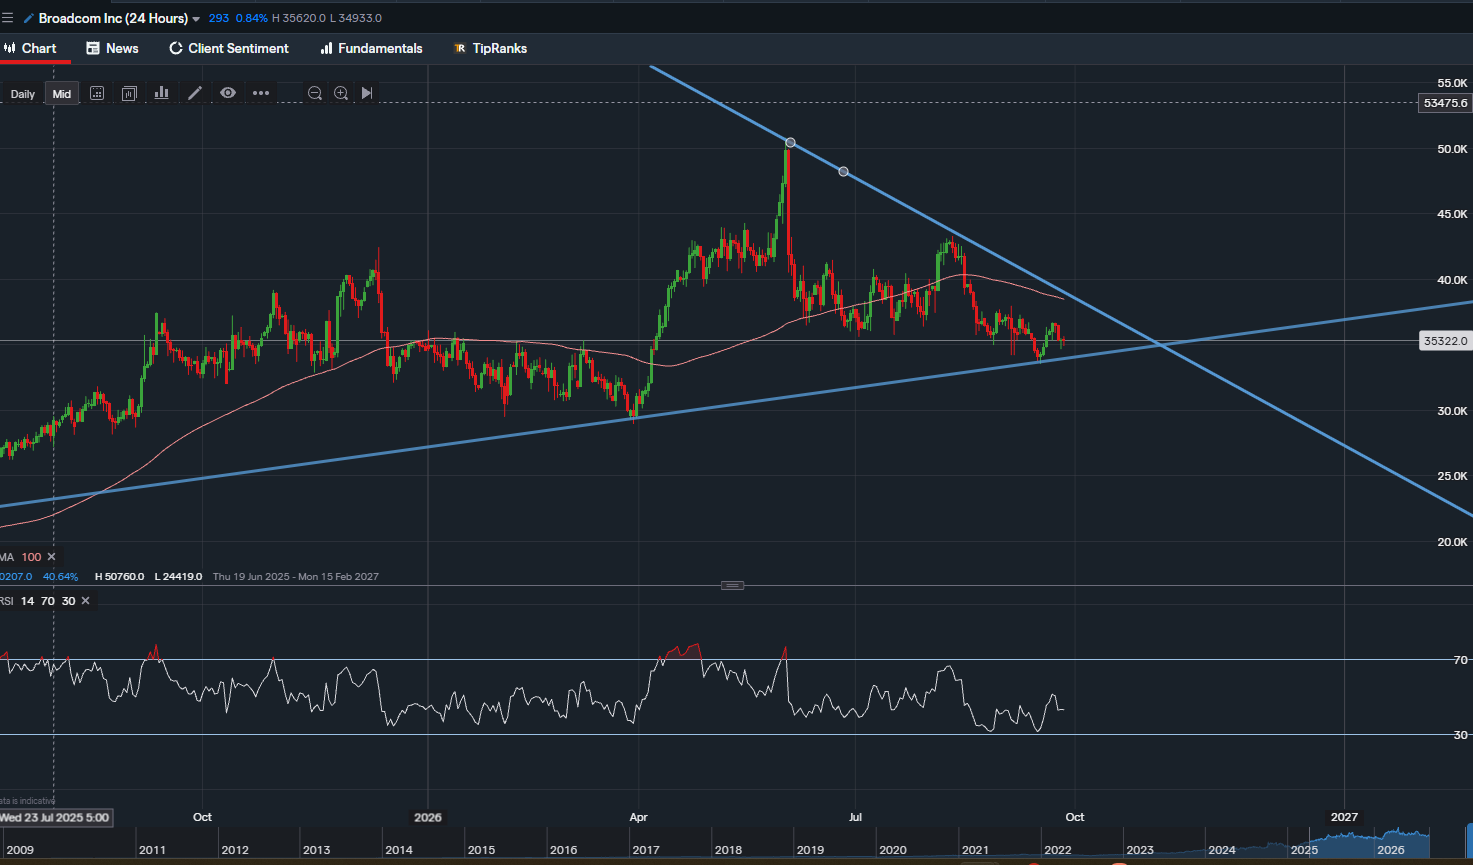
Broadcom Holds Long Term Support as Two Trend Lines Close In


What has been happening
Broadcom has been one of the standout names of the AI boom. It designs the custom chips and networking equipment that the largest tech companies use to build their data centres. Yet 2026 has been a year of two halves for the share price. After a strong run to a record high in June, the stock has spent the last few months drifting lower and now trades around $353, roughly 30% below that peak. On the daily chart, price is being squeezed into a tighter and tighter space between two trend lines, and that squeeze is close to running out of room.
The pullback is not the story of a business in trouble. It is a story of expectations. In early June Broadcom reported strong quarterly numbers, but its guidance for AI chip sales came in at about $16 billion, below the roughly $17.2 billion some analysts had pencilled in. You can see the reaction clearly on the chart: the tall spike to the June high is followed almost immediately by a steep drop.
The latest results, released on 2 September, were the best in the company's history. Revenue rose 86% year on year to $29.6 billion, and AI chip revenue alone reached $16.7 billion, up 221% on the same period last year. Management expects fourth quarter revenue of around $34.8 billion, with AI chip revenue accelerating again to $21.7 billion. Even so, that revenue forecast was a touch below the $35.2 billion Wall Street was expecting, and the software division, which includes VMware, also came in slightly under estimates. When a stock is priced for near perfection, very good results are not always enough.
A couple of other headlines have weighed on sentiment. In August, shares fell after reports that a serious VMware security flaw was being actively exploited by attackers, and more recently chairman Henry Samueli filed to sell 632,000 shares over the next 90 days. On the positive side, the customer pipeline keeps growing. CEO Hock Tan said Broadcom expects Anthropic to deploy 5 gigawatts of its TPU chips in 2027, while OpenAI is getting ready for its second generation chip and already planning a third.
Key levels: the trend lines
The most important feature of this chart is the pair of trend lines now closing in on each other.
The rising trend line has supported Broadcom since early 2025, connecting a series of higher lows including the April low near $295. The mid September dip to around $338 found buyers right on this line, which is an encouraging sign for the bulls. Price is currently sitting only just above it, so this is the line to watch in the days ahead.
Above, the falling trend line drawn from the June high has capped every rally since. It stopped the August bounce near $435 almost to the dollar, and it now sits somewhere around $395 to $400.
Together these lines form a narrowing triangle, and they meet around late October or early November. Patterns like this tend to end with a decisive move one way or the other, and with the next earnings report not expected until 10 December, the chart may well make its decision before the fundamentals get their next update.
A hold of the rising trend line followed by a break above the falling one would suggest the correction is over, opening the way back towards the August high near $435 and eventually the $500 area. A clear close below the rising trend line, on the other hand, would be the first real crack in a trend that has held for well over a year, with the April low around $295 the next obvious area of support.
Moving average and RSI
The 100 day moving average sits around $385 and has started to flatten and turn lower. Price has been trading below it since mid August, and because it now lines up closely with the falling trend line, the $385 to $400 zone looks like a heavy ceiling that buyers will need to clear.
The RSI reads around 44. It dipped towards 30 in September without quite reaching oversold territory and has since recovered to neutral. It has not been anywhere near 70 since June, which tells us momentum has been missing on the way up. On its own a neutral RSI says little, but in this context it fits the picture of a market waiting for direction rather than one that is stretched either way.
Fundamentals
Broadcom is not a cheap stock. It trades on a price to earnings ratio of roughly 45, meaning investors are paying about $45 for every $1 of yearly profit. That is well above the wider market, but it reflects just how fast profits are growing. Adjusted earnings per share came in at $3.32, up 96% on last year, and the company turned 46% of its revenue into free cash flow, around $13.7 billion in a single quarter.
For income investors the appeal is modest. The quarterly dividend is $0.65 per share, a yield of around 0.7%. Analysts remain firmly positive, with 23 Buy ratings, four Holds and no Sells in the past three months, and an average price target of around $532, well above where the shares trade today.
Summary
Broadcom's business looks as strong as it has ever been, but the share price has been paying the price for sky high expectations. Technically the stock is at a genuine decision point. The rising trend line is the level buyers need to defend, while a push through the falling trend line and the 100 day moving average would be the signal that momentum has turned back in their favour. Until one of those lines gives way, patience and a clear plan for managing risk make more sense than trying to guess the direction of the breakout.

Tradable assets:
Min.Deposit:
Max Leverage:
FCA:

Rating:
 Earnings Calendar
  Economic Calendar
  VAT Calculator
  Tax Free Childcare Calculator
 Percentage Calculator
 Compound Interest Calculator
  Loan Overpayment Calculator
 Mortgage Calculator
 Credit Card Calculator
 Investing
  Economics
 Trading
  Technical Analysis
  Personal Finance
 Calculator