News
FTSE 100 Rises as UK Housebuilders Surge on New First-Time Buyer Scheme
28 Sep 2026, 16:19


Join Minipip Academy and access free courses in investing, trading, economics, and more.
Sign Up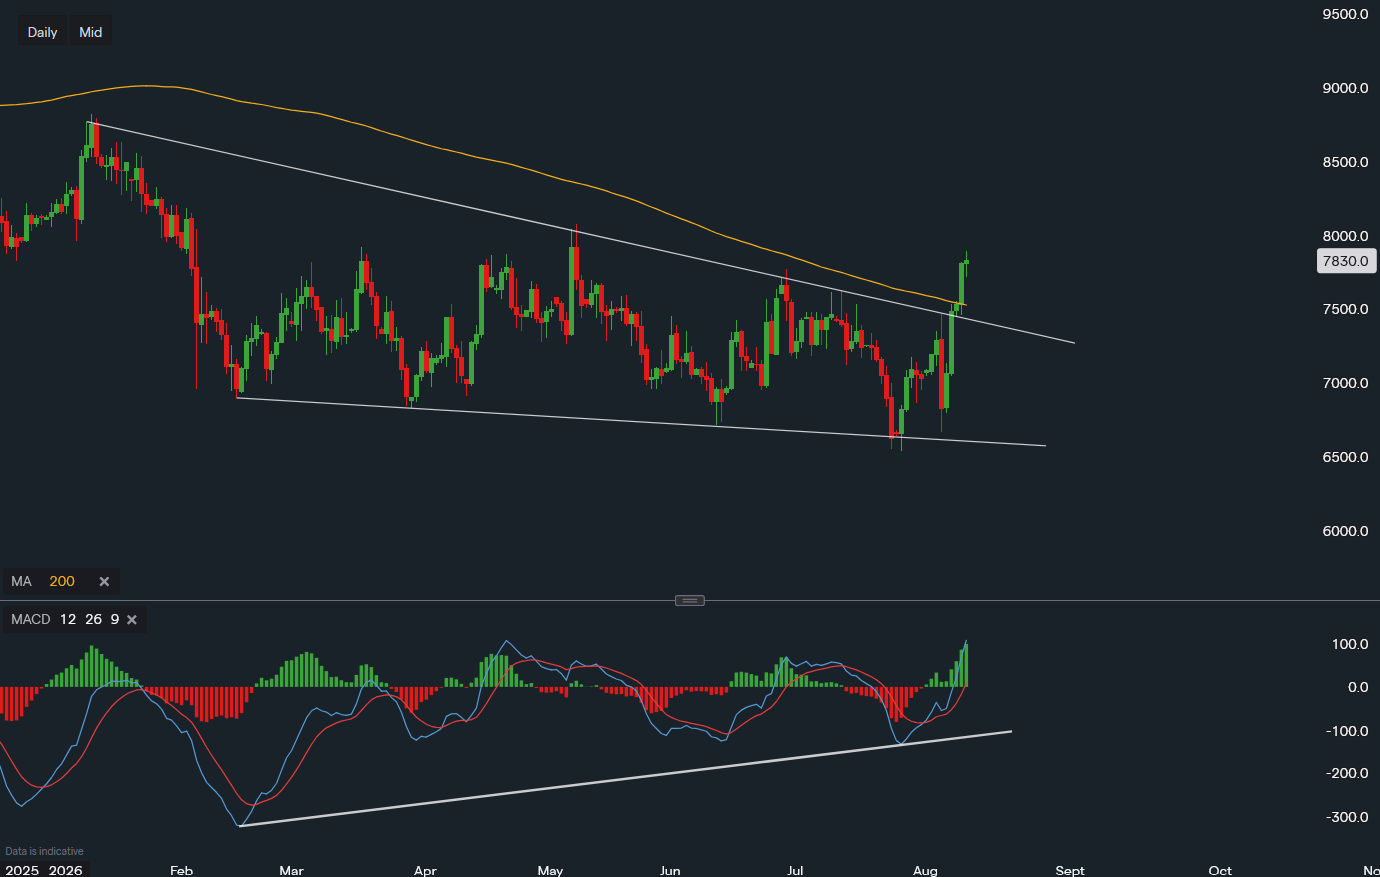
(Chart & Data from IG)


Uber Stock Analysis: Bullish Breakout After Q2 Earnings and AV Expansion Plans
Uber Technologies (NYSE: UBER) has staged a notable recovery in recent sessions, climbing from below $70 to around $78.30 following its Q2 2026 earnings report. Despite a slight revenue miss versus Wall Street estimates, the company's strong free cash flow generation and aggressive autonomous vehicle (AV) rollout have reignited investor interest.
Fundamental Strength: Cash Flow and AV Strategy
Uber reported Q2 2026 revenue of $14.19 billion, up 12.2% year-over-year but just shy of the $14.24 billion consensus estimate. However, the company delivered record trailing twelve-month free cash flow exceeding $10 billion for the first time in its history—a key milestone that underscores improving profitability and capital efficiency.
Management highlighted plans to deploy autonomous vehicles across 15 cities globally by the end of 2026, including London, Los Angeles, and Hong Kong. Rather than manufacturing its own AVs, Uber is positioning itself as the platform layer—partnering with providers like WeRide to integrate robotaxis into its app. This "middleman" strategy insulates Uber from the capital-intensive and regulatory hurdles of AV production while capturing demand regardless of which hardware provider wins.
The company also reported its fastest growth in new app users in over four years, suggesting resilient demand despite macro headwinds and AI disruption concerns.
Technical Breakout: MACD Divergence and 200-Day SMA
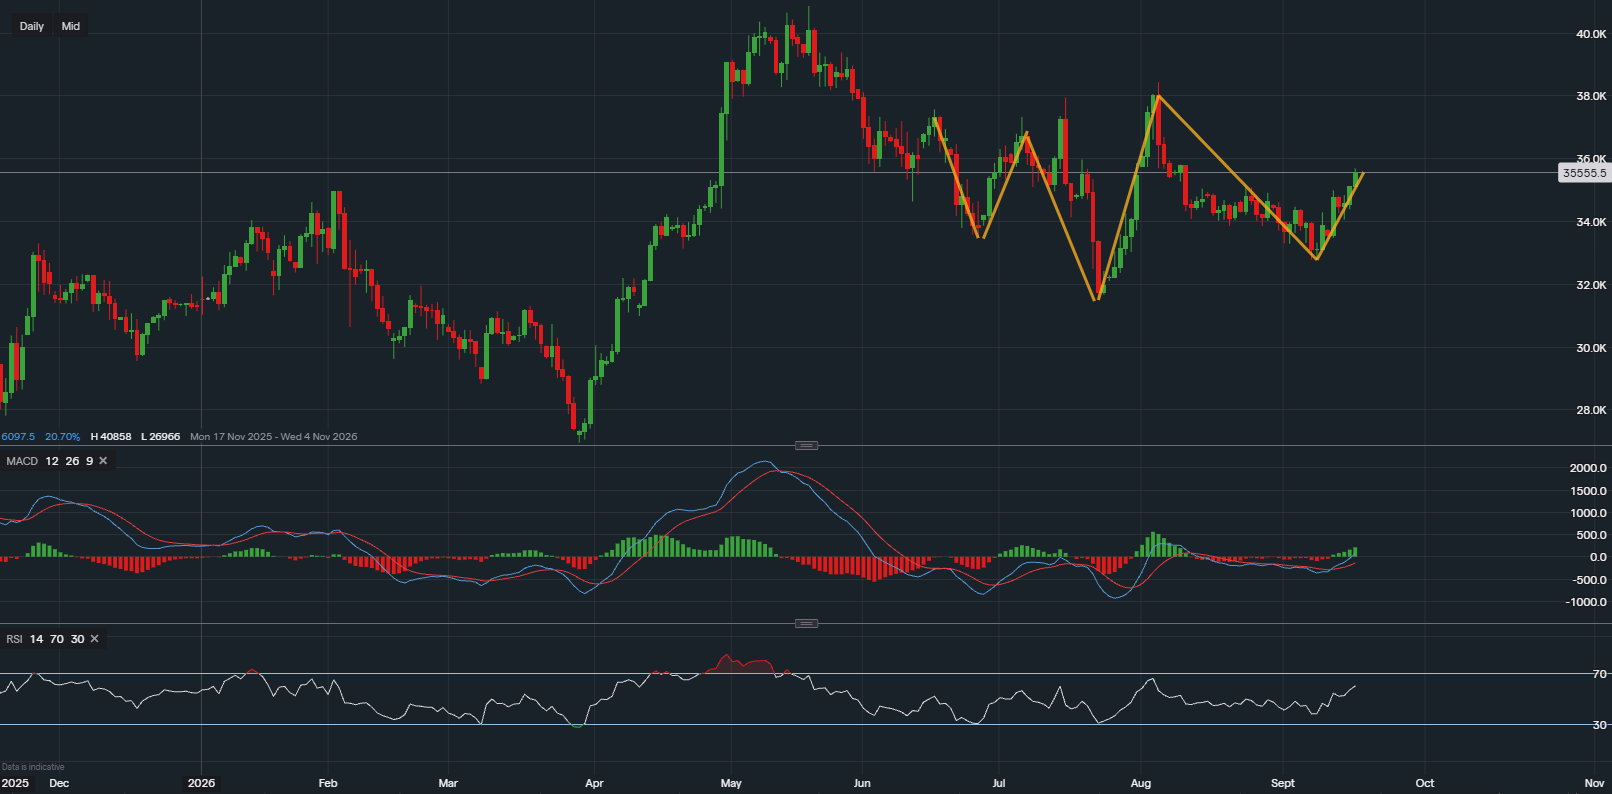
From a chart perspective, Uber's daily price action shows two compelling technical signals:
These factors together suggest a possible transition from a downtrend to a new upward channel over the coming months.
Key Price Levels: Resistance and Support
Investment Takeaway
Uber's combination of record free cash flow, strategic AV partnerships, and improving technical structure makes it a compelling watchlist candidate for both fundamental and technical traders. While near-term volatility is possible, the confluence of strong cash generation, platform-level AV exposure, and bullish chart patterns supports a constructive medium-term outlook.
Disclaimer: THE CONTENT ON OUR SITE IS PROVIDED FOR GENERAL INFORMATION ONLY. IT IS NOT INTENDED TO AMOUNT TO ADVICE ON WHICH YOU SHOULD RELY.

Tradable assets:
Min.Deposit:
Max Leverage:
FCA:

Rating:
 Earnings Calendar
  Economic Calendar
  VAT Calculator
  Tax Free Childcare Calculator
 Percentage Calculator
 Compound Interest Calculator
  Loan Overpayment Calculator
 Mortgage Calculator
 Credit Card Calculator
 Investing
  Economics
 Trading
  Technical Analysis
  Personal Finance
 Calculator