Microsoft (MSFT): AI Leadership Supports Long-Term Growth
$396.94
21 Jul 2026, 22:43
Neutral

Join Minipip Academy and access free courses in investing, trading, economics, and more.
Sign Up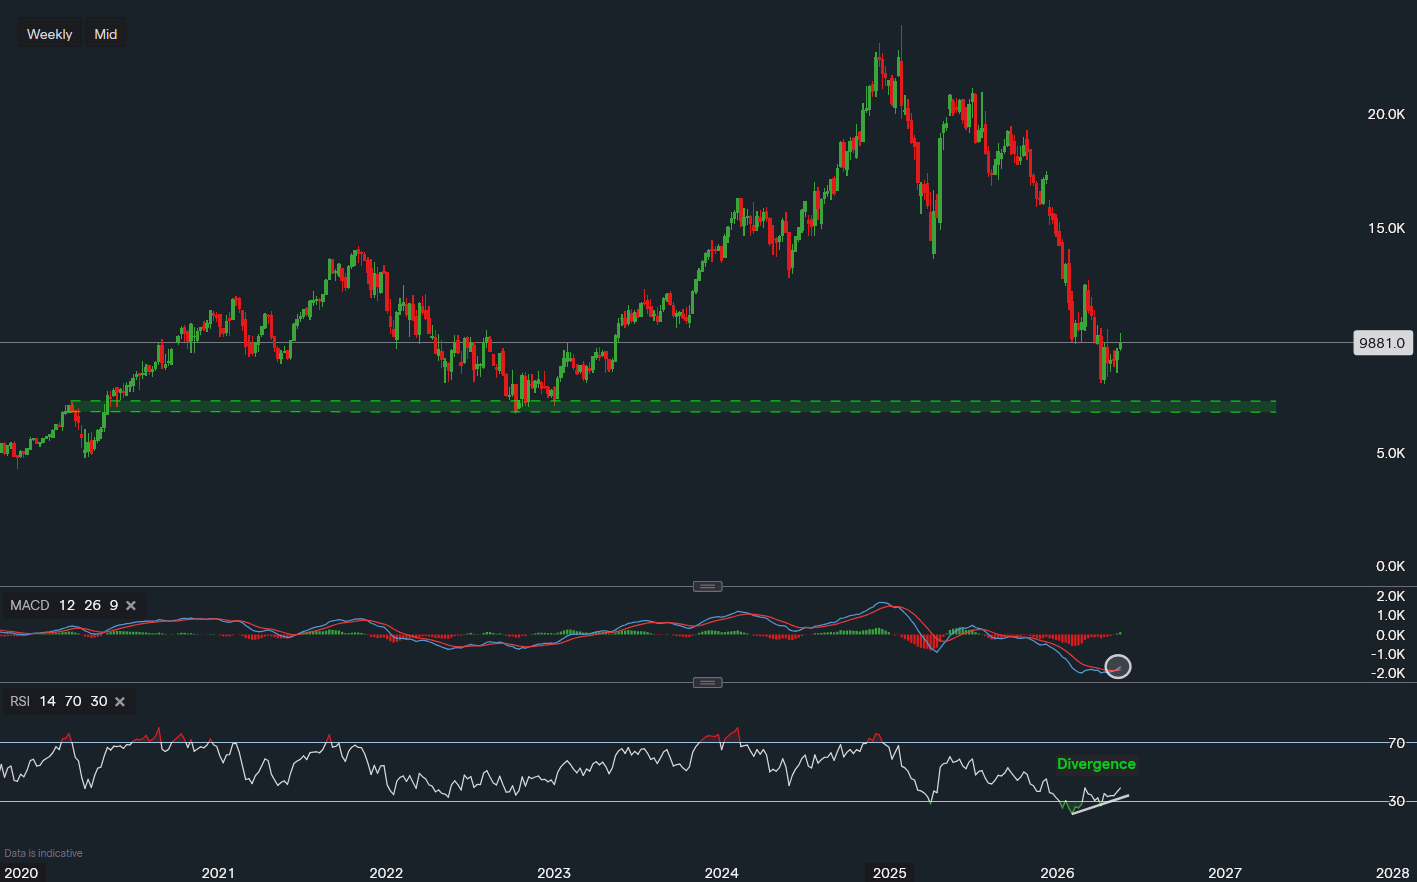
Chart & Data from IG
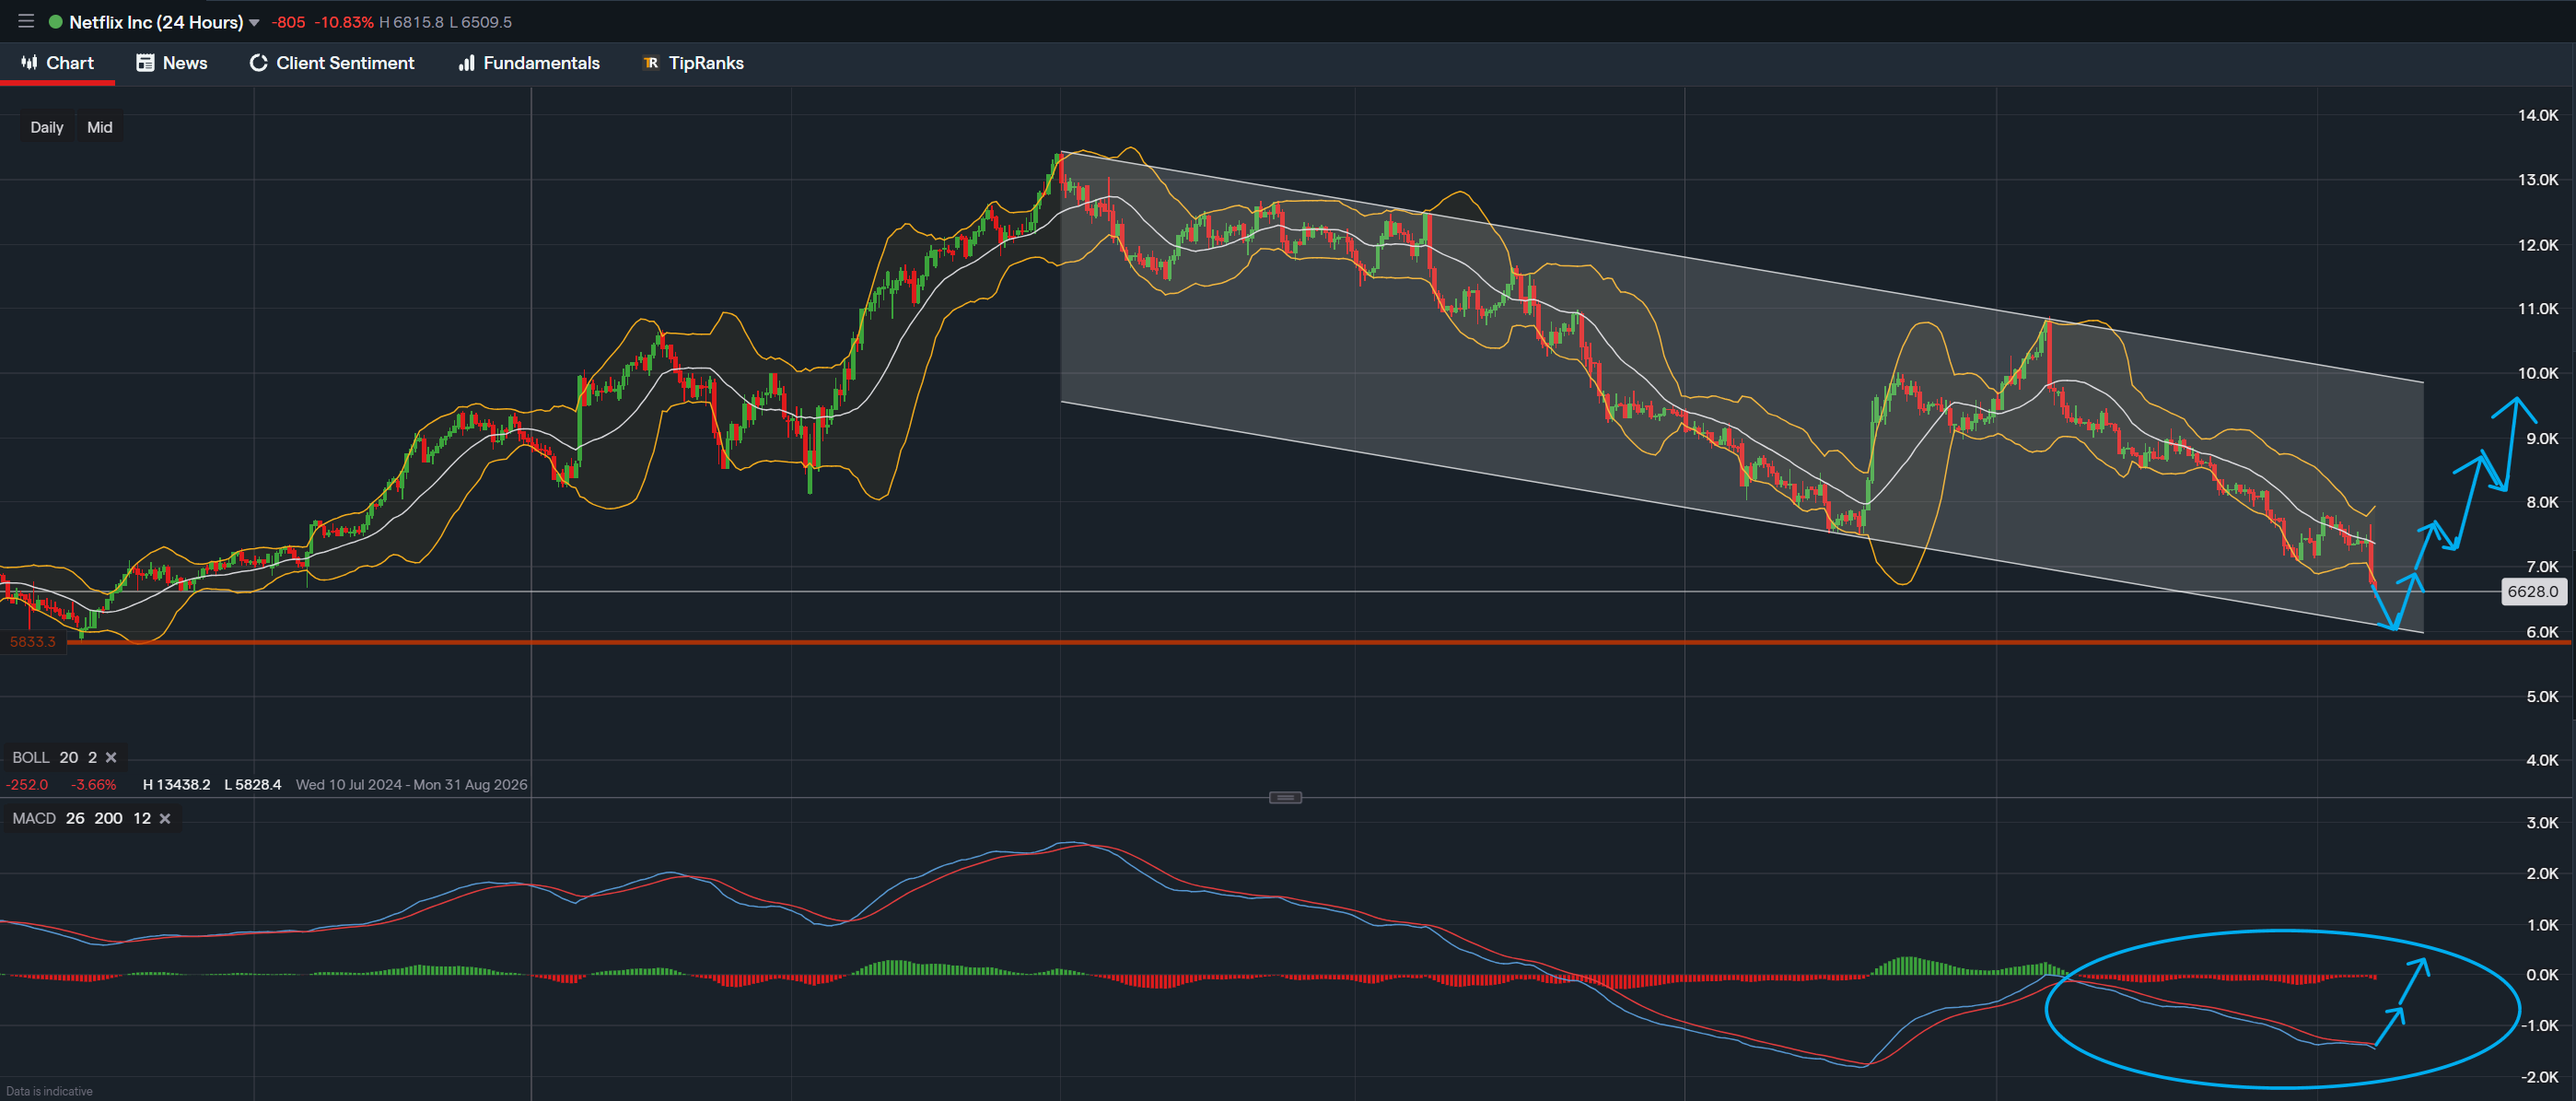
ServiceNow’s recent price action and technical indicators suggest the stock may be positioning for upside in the short to mid term, following a significant decline from January 2025 to April 2026. Evidence pointing toward a potential interim bottom is steadily increasing.
On the weekly timeframe, momentum indicators are beginning to turn constructive. The MACD line has crossed above its signal line and closed above it for the first time since July 2025, indicating a potential shift in trend.
At the same time, the Relative Strength Index (RSI) has recovered from oversold conditions, rising to from at the April lows. Notably, the RSI is also showing signs of bullish divergence. Since the week commencing 2 February 2026, RSI has been forming higher lows while the share price continued to print lower lows.
This divergence often signals strengthening underlying demand. It suggests that buyers are gradually stepping in more aggressively, even as price weakness continues to shake out weaker hands. The recent uptick in RSI reinforces the idea that buying momentum is building beneath the surface.
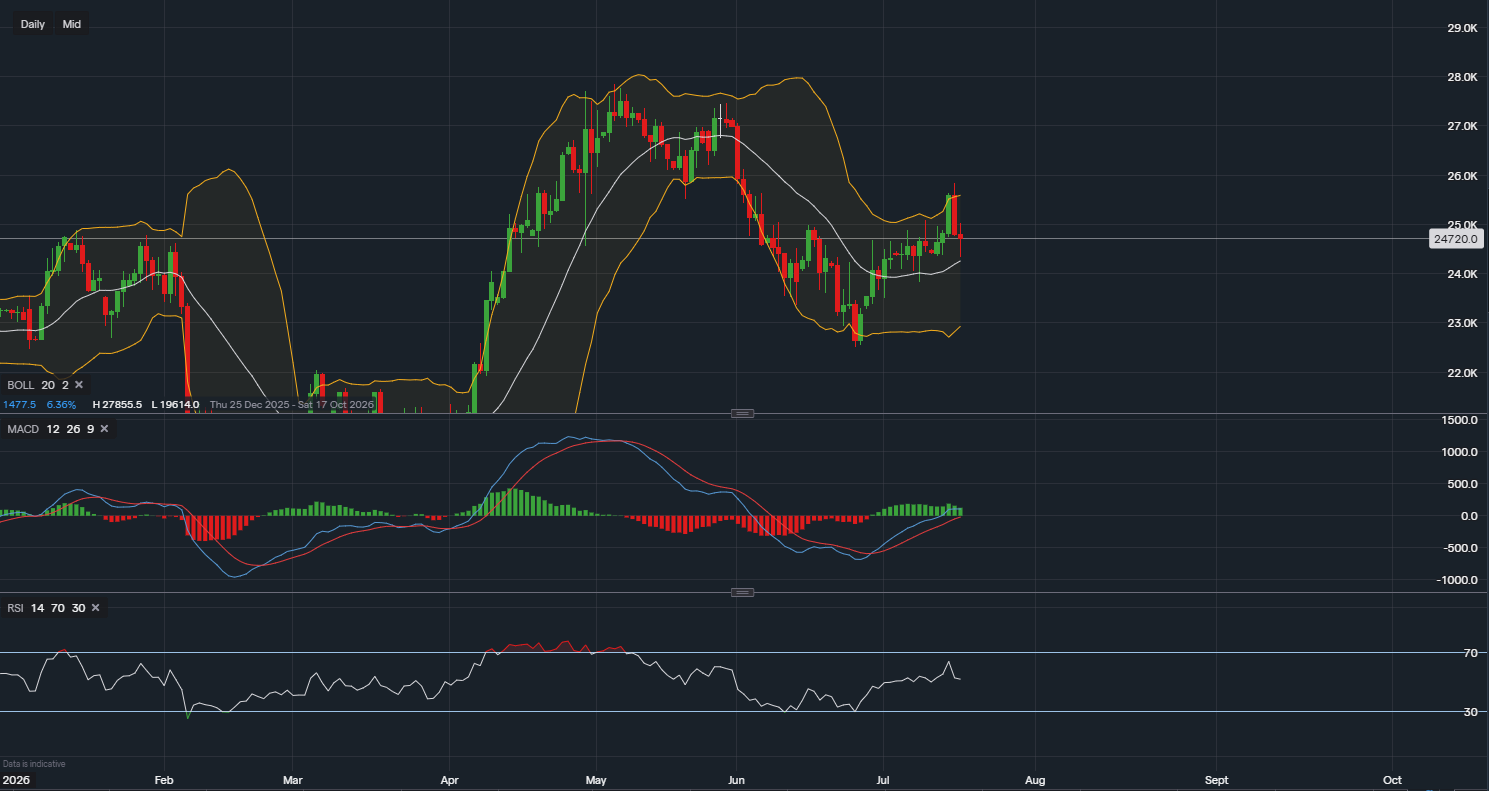
The bullish narrative is further supported on the daily chart, where price action is indicating a potential breakout from the recent downtrend.
A key resistance zone lies between and , which has acted as a breakout area. Price behavior around this region will be critical in confirming a trend reversal.
The post-earnings sell-off now appears to have been overextended. Buyers have since stepped in, forming a base between and , while the 52-week low of has not been retested. This suggests increasing price stability and accumulation.
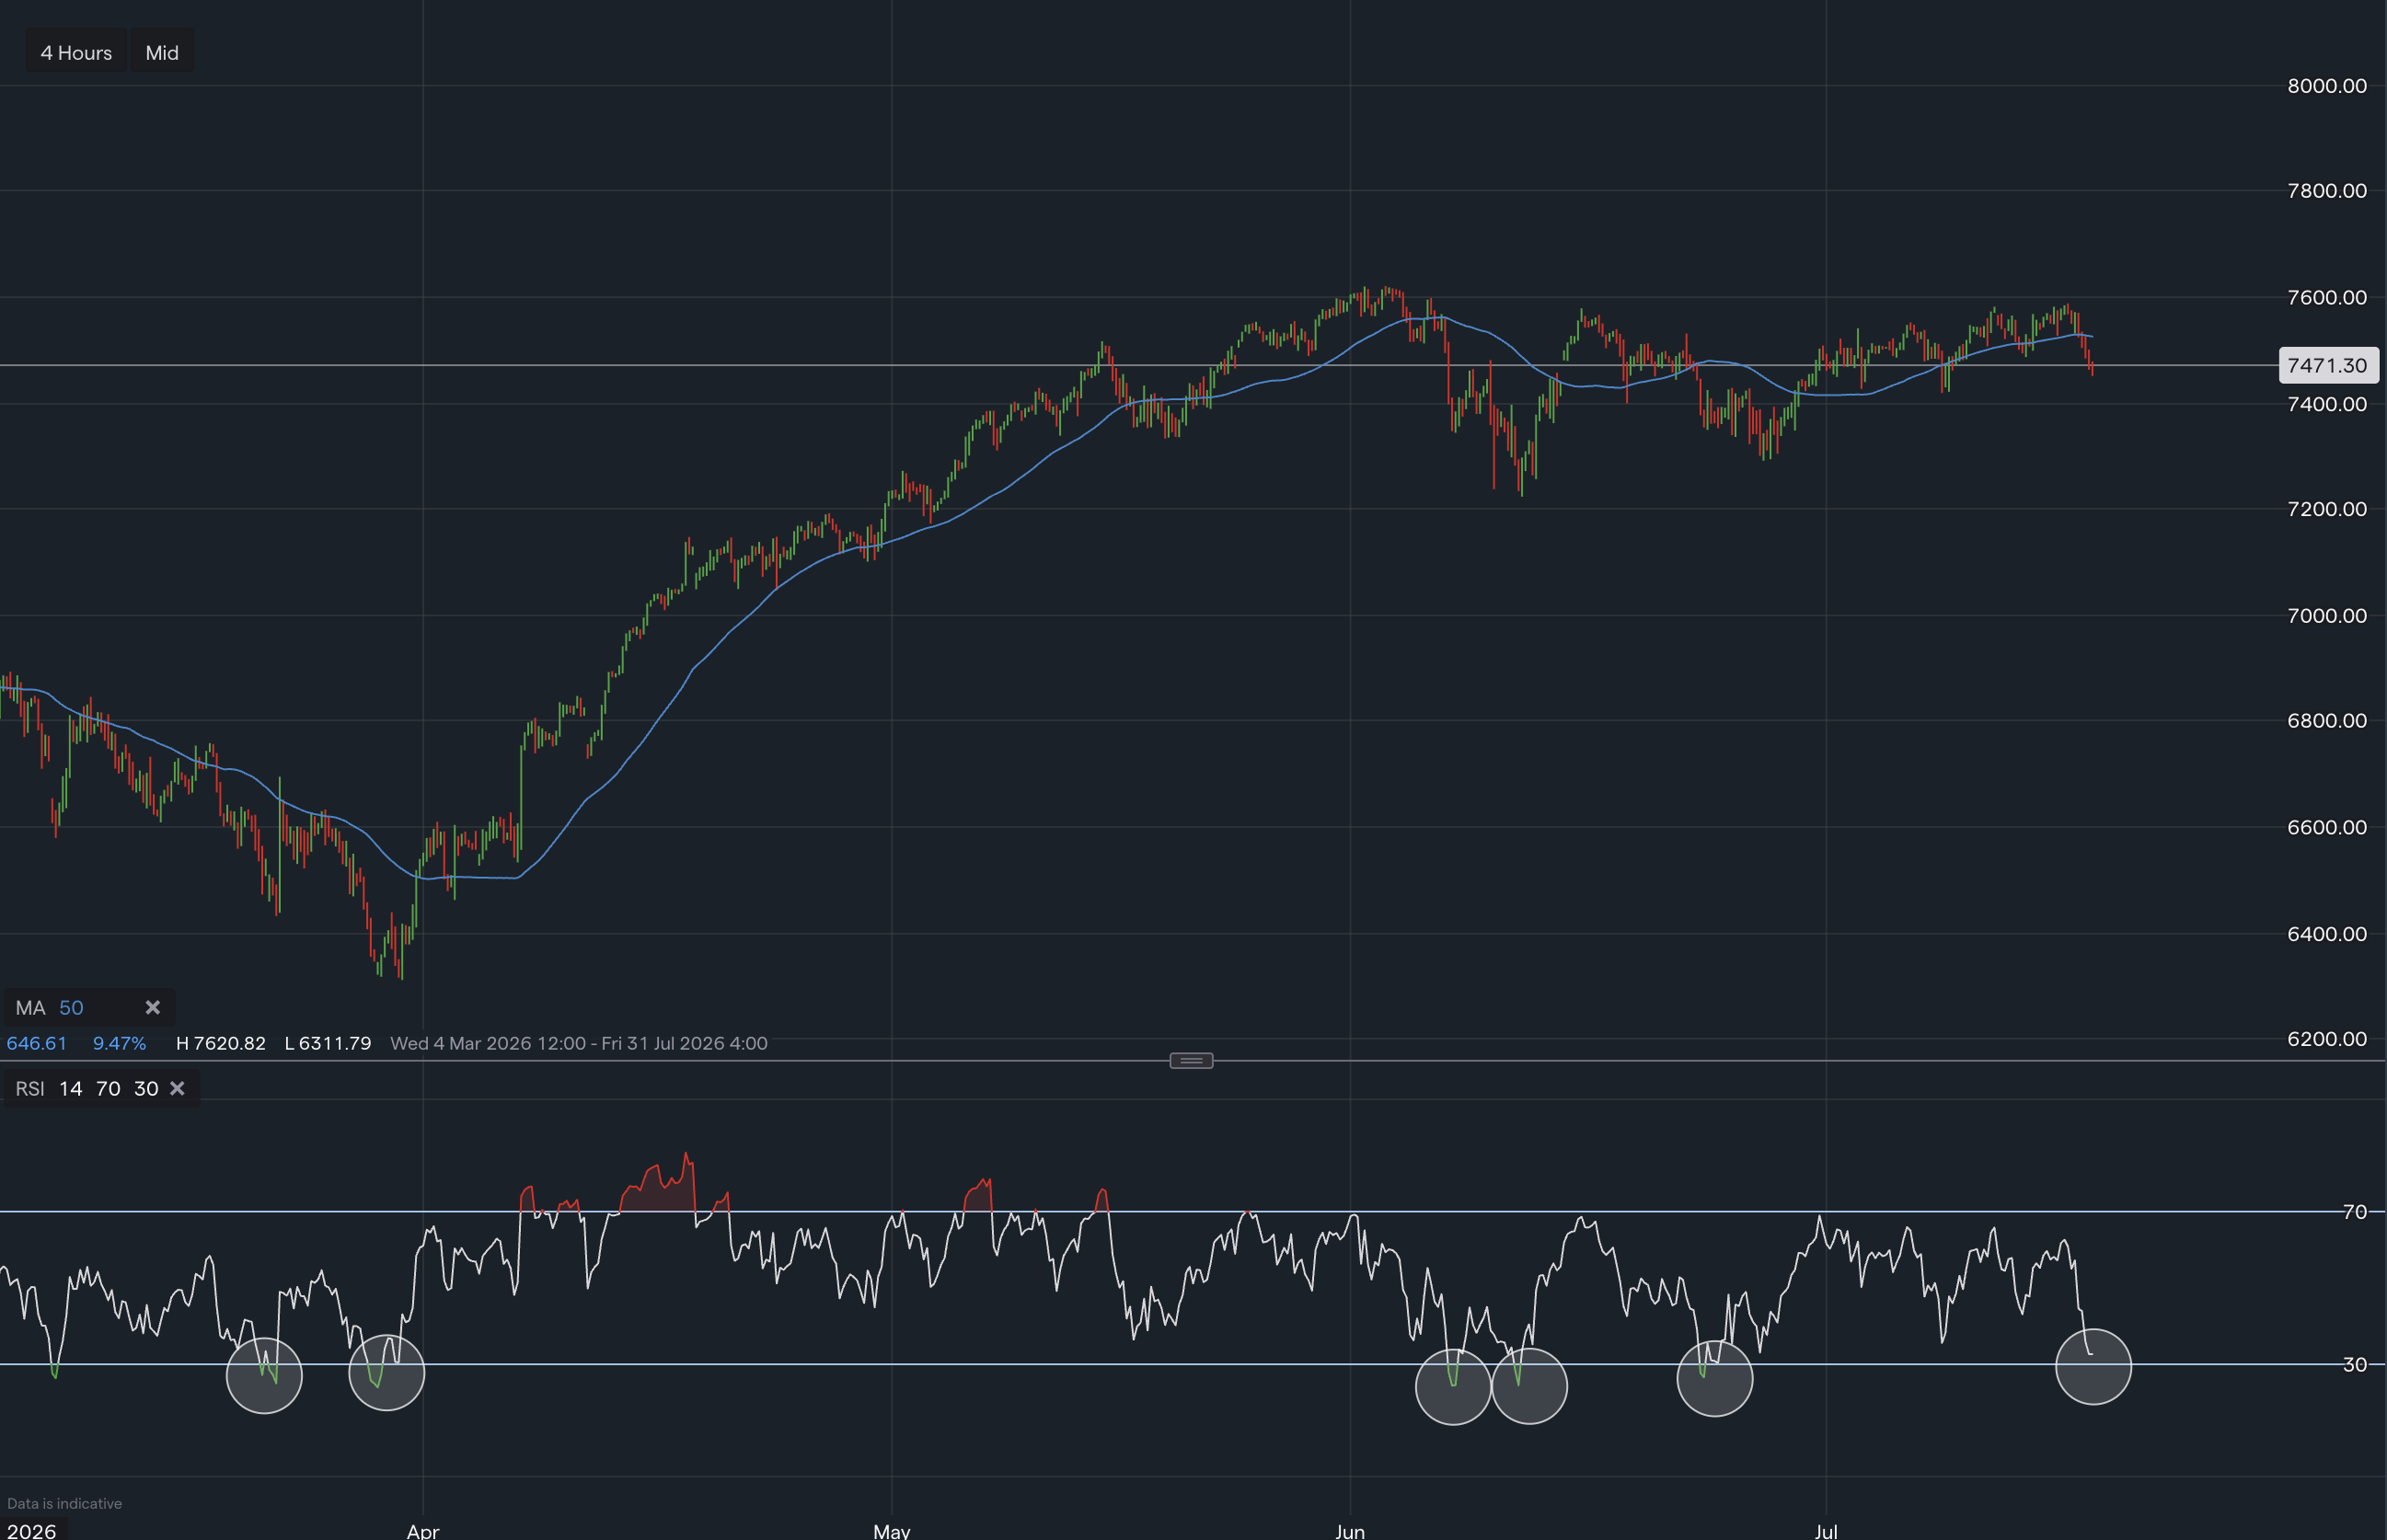
Both MACD and RSI on the daily timeframe are trending higher and moving out of oversold territory, further reinforcing the improving technical outlook.
Beyond technical indicators, institutional sentiment is also turning more positive. According to TipRanks, 39 Wall Street analysts have provided 12-month ratings on ServiceNow. Of these, 35 rate the stock as a “buy,” while 4 suggest a “hold.”
The average price target stands at , implying nearly upside from current levels.
Additionally, Bank of America initiated coverage with a buy rating on 18 May 2026, assigning a price target of . This development highlights a growing institutional shift toward optimism, particularly as concerns around AI-driven disruption in software stocks begin to stabilise.
Disclaimer: This content is for informational and educational purposes only and does not constitute financial, investment, or trading advice. All opinions expressed are based on personal analysis and are subject to change. You should conduct your own research or consult with a qualified financial advisor before making any investment decisions.

Tradable assets:
Min.Deposit:
Max Leverage:
FCA:

Rating:
 Earnings Calendar
  Economic Calendar
  VAT Calculator
  Tax Free Childcare Calculator
 Percentage Calculator
 Compound Interest Calculator
  Loan Overpayment Calculator
 Mortgage Calculator
 Credit Card Calculator
 Investing
  Economics
 Trading
  Technical Analysis
  Personal Finance
 Calculator