Oracle Share Price Outlook: Could Oversold RSI Signal a Bullish Reversal?
$140.94
05 Jul 2026, 08:55
Bullish

Join Minipip Academy and access free courses in investing, trading, economics, and more.
Sign Up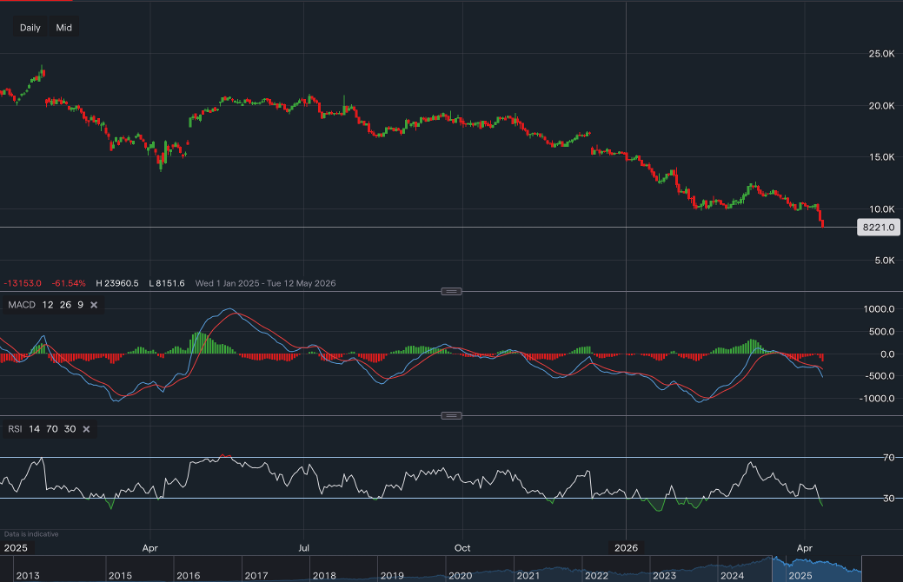
ServiceNow (NOW) Analysis: Strong Fundamentals Clash with a Bearish Technical Pressure
Front Page / Snapshot
ServiceNow (NOW) is a US-listed enterprise software company trading on the New York Stock Exchange, operating within the technology sector and specialising in cloud-based workflow and automation platforms for large organisations.
The stock has a highly liquid structure, with the vast majority of its shares actively tradable in the market. Ownership is heavily institutional, with major positions held by Vanguard Group, BlackRock, and State Street Corporation, reflecting strong long-term investor participation.
This institutional dominance provides underlying stability and confidence in the company’s long-term prospects. However, it also introduces a key risk dynamic, as large-scale portfolio reallocations by these entities during periods of macroeconomic stress can accelerate downside volatility and amplify sell-offs.
Fundamental Snapshot
From a fundamental perspective, the stock appears expensive on a trailing basis, with a P/E ratio of 49.37, but this compresses sharply to 16.34 on a forward basis, reflecting expectations of significant earnings expansion. Earnings are projected to increase from $1.75B to $5.28B, representing growth of approximately 201%, with EPS rising from $1.67 to $5.04 over the same period. Under the Minipip Valuation Model, applying an average P/E of 32.86 implies a projected market capitalisation of $173.5B, suggesting around 101% upside from current levels.
Analyst Consensus & Market Expectations
Analyst sentiment on ServiceNow remains strongly positive, with 35 total ratings comprising 30 Buy, 4 Hold, and just 1 Sell, reflecting a clear consensus in favour of the company’s long-term growth outlook. Price targets reinforce this optimism, ranging from $100 on the downside to $240 on the upside, with an average target of $179.65, implying approximately 118.63% upside from current levels.
This bullish positioning is driven by improving profitability, low leverage, and strong cash flow, alongside expectations of continued margin expansion into 2026. ServiceNow’s subscription-first model and deep penetration within large enterprises provide durable and predictable revenue streams, supported by high remaining performance obligations and a growing volume of large, multi-year contracts. These factors underpin strong visibility in future earnings and reinforce client retention.
At the same time, analysts highlight several offsetting risks. Weak technical momentum, with the stock trading below key moving averages and showing negative MACD signals, suggests continued near-term pressure.
A key fundamental concern is the observed deceleration in revenue growth. If sustained, this could reduce operating leverage and constrain margin expansion; this is the primary downside factor within an otherwise constructive long-term outlook which introduces risk over the coming quarters.
Price Action & Technical Analysis
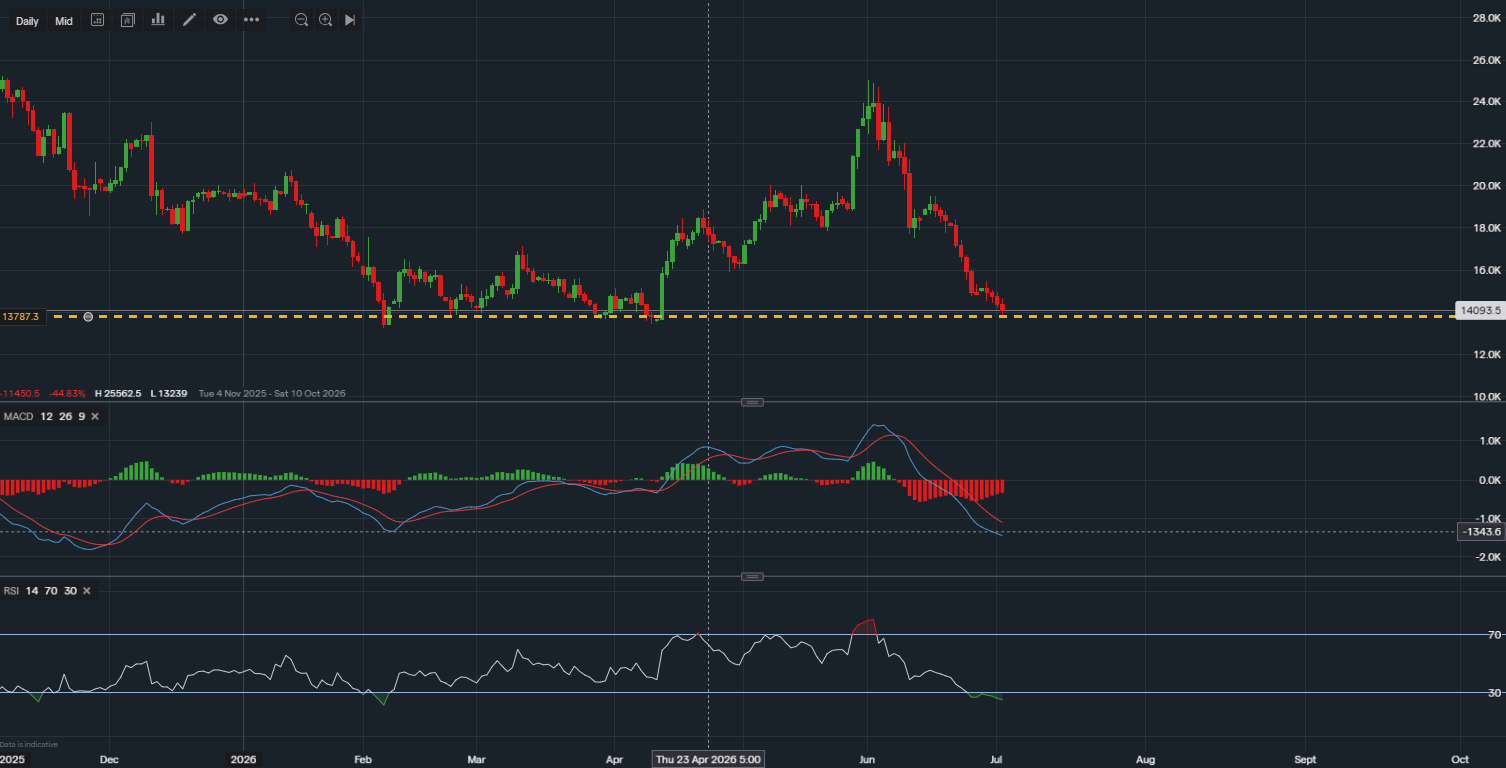
ServiceNow is currently trading near its 52-week lows, having declined significantly from a prior high above $211, indicating a substantial market repricing despite a strong long-term growth narrative.
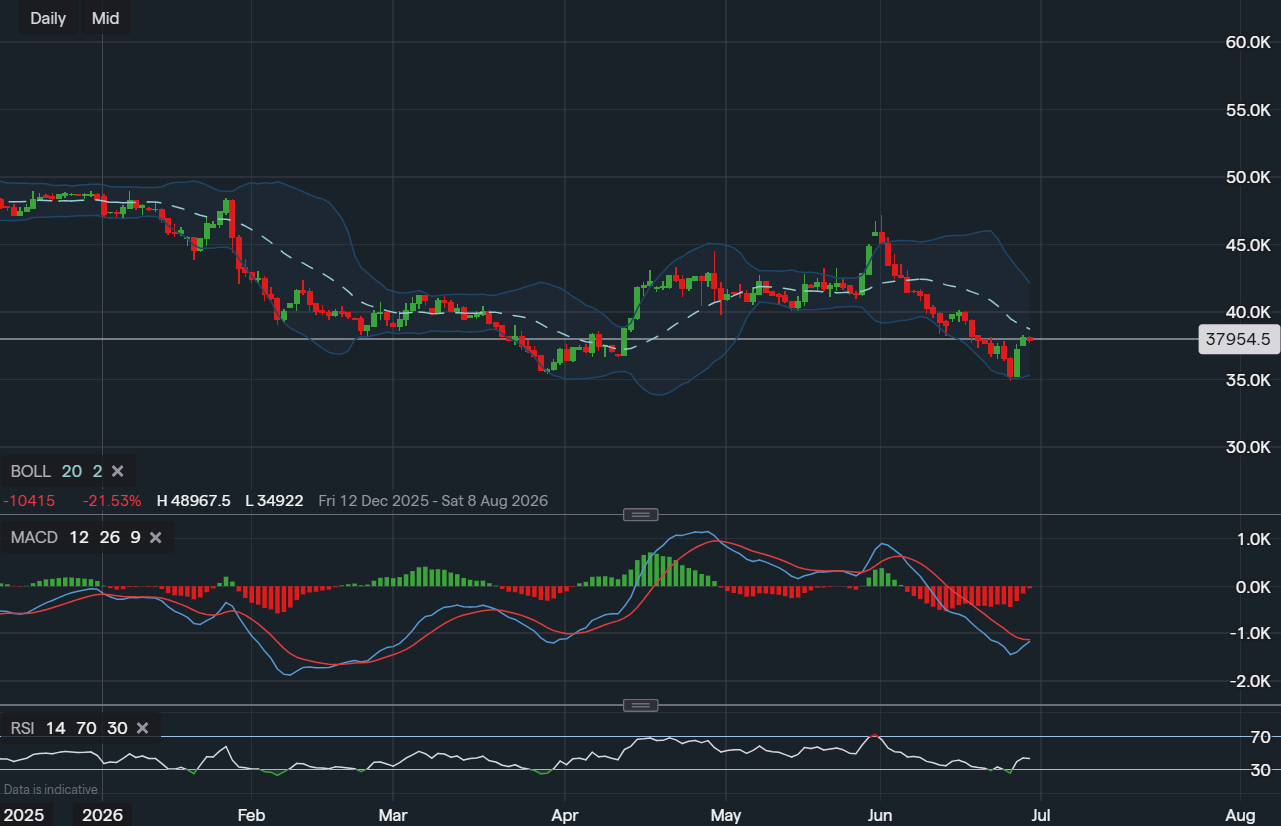
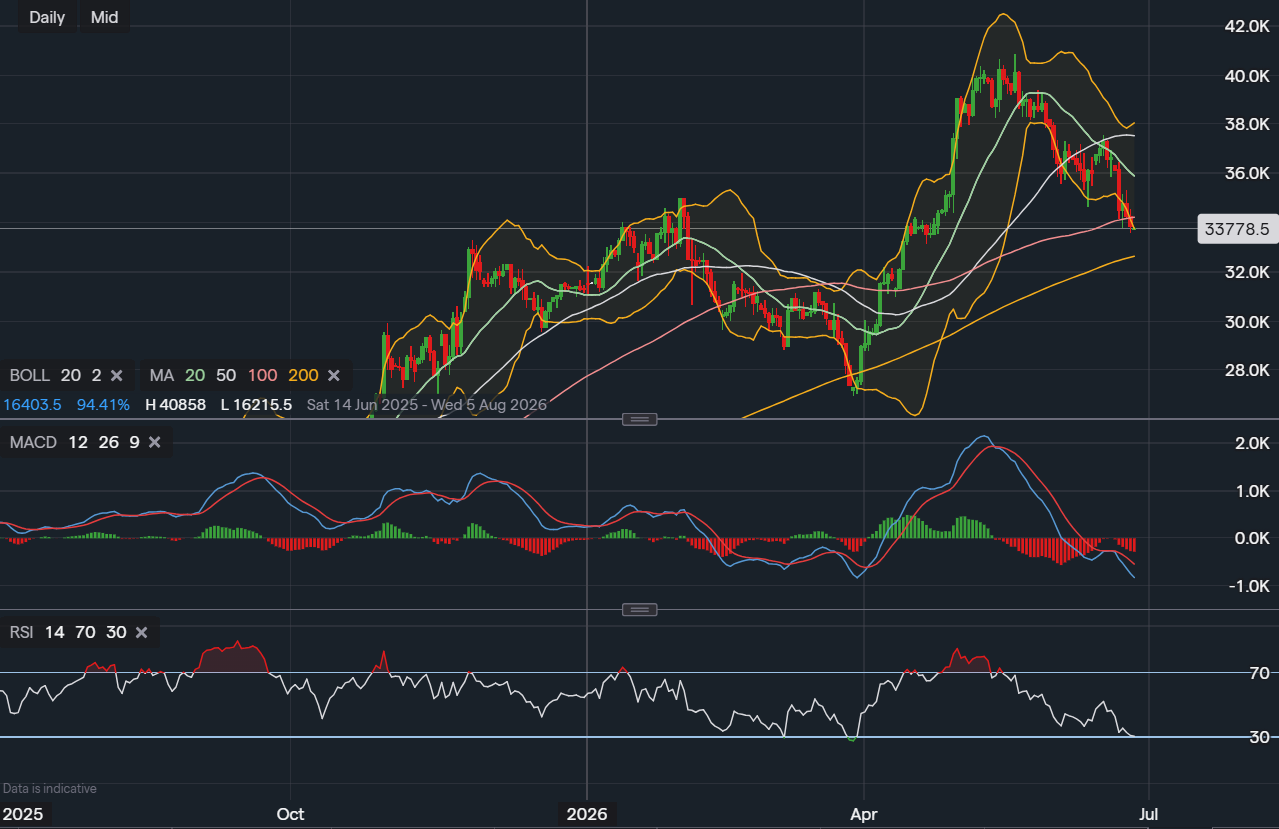
The technical structure for ServiceNow remains firmly bearish, with price action continuing to form a clear sequence of lower highs and lower lows, indicating no confirmed break in trend. The stock is trading below the Ichimoku cloud, with the cloud itself acting as overhead resistance, while the conversion and base lines remain above current price, reinforcing a sustained bearish regime. This is further supported by the EMA structure, where the moving averages are aligned bearishly (20 < 50 < 200), with price trading beneath all key levels.
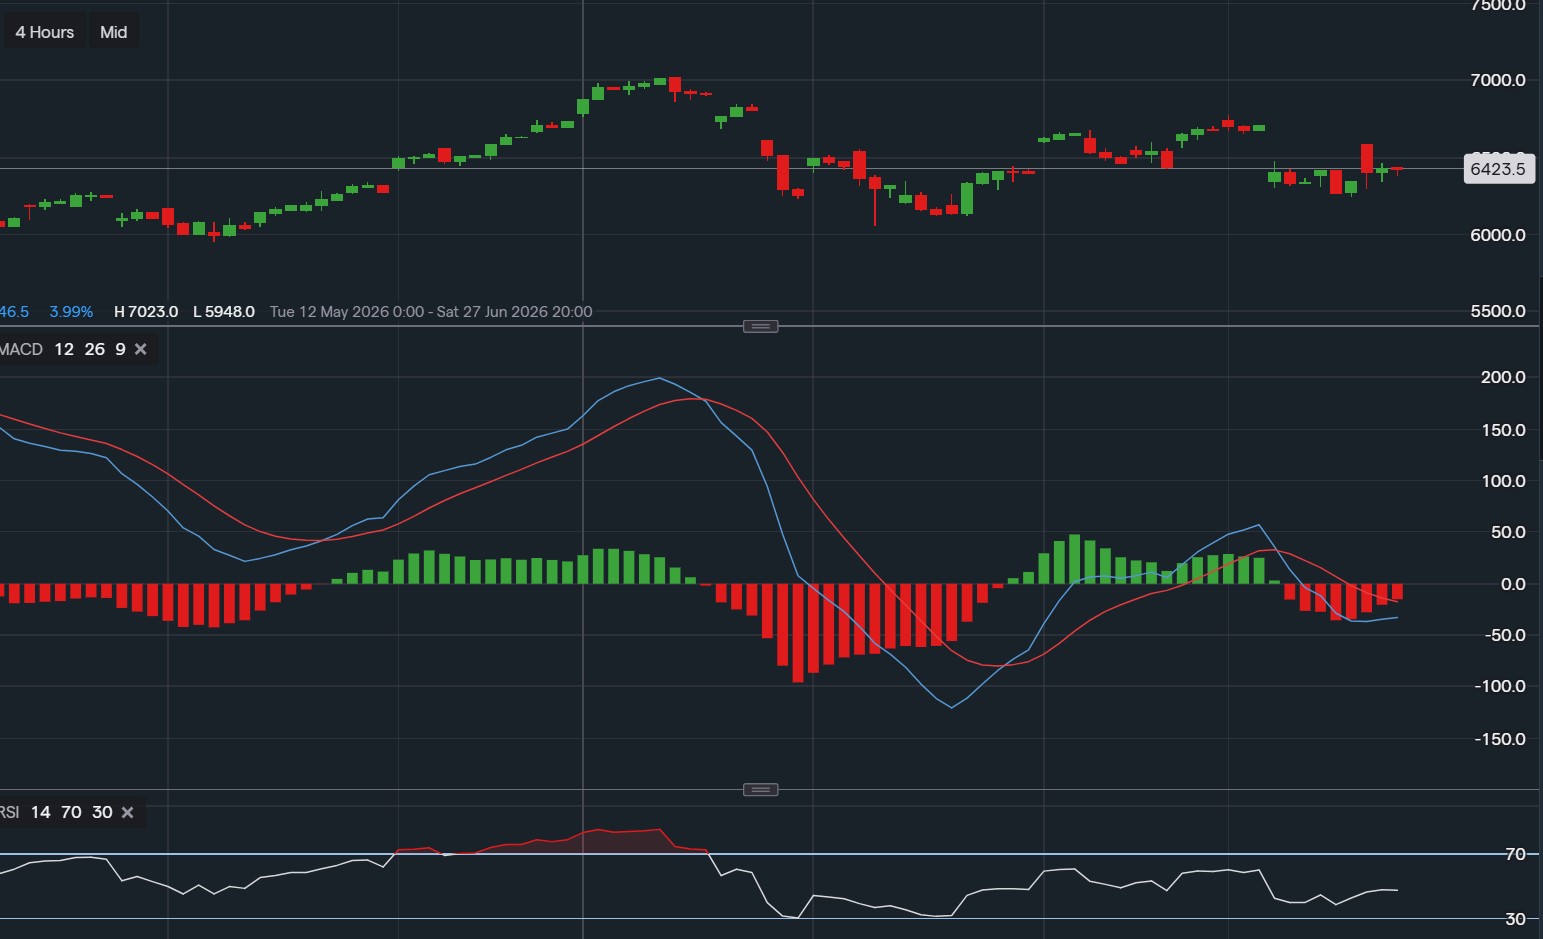
Momentum indicators are aligned with this bearish outlook. The DMI shows strong seller dominance, with -DM significantly outweighing +DM, while an ADX reading of 27.3 confirms that the trend is not only bearish but also gaining strength. Similarly, the MACD remains negative, with the histogram below zero and the MACD line beneath the signal line, indicating continued downward momentum. Although the RSI is deeply oversold at 21.86, this should not be interpreted as an immediate reversal signal, as oversold conditions can persist during strong trending environments.
Volatility conditions further support continuation, with Bollinger Bands expanding, suggesting increasing price movement.
From a price action perspective, the stock is currently testing a key support zone around $80-82, corresponding to levels last seen in May 2023. Meanwhile, resistance continues to trend lower, with repeated lower highs forming approximately every 20 to 40 days, confirming persistent selling pressure and a lack of bullish conviction.
Overall, the technical bias remains decisively bearish across short, medium, and long-term timeframes. While fundamentals may support a longer-term recovery, there is currently no technical confirmation of reversal, and prevailing conditions continue to favour downside continuation or prolonged consolidation before any meaningful bullish shift emerges.
Conclusion
ServiceNow presents a high-quality fundamental growth profile with significant projected earnings expansion and strong institutional backing. However, the stock is currently undergoing a pronounced technically bearish phase, with price action firmly entrenched in a downtrend across all major timeframes.
In its current state, a higher-probability long opportunity may only emerge once clear signs of accumulation or trend reversal develop. Until then, the prevailing trend remains dominant, and positioning should align with bearish momentum rather than anticipating premature reversal.
Educational Disclaimer
This content is for educational and informational purposes only and should not be considered financial advice. Always conduct independent research or consult a qualified financial professional before making investment decisions.

Tradable assets:
Min.Deposit:
Max Leverage:
FCA:

Rating:
 Earnings Calendar
  Economic Calendar
  VAT Calculator
  Tax Free Childcare Calculator
 Percentage Calculator
 Compound Interest Calculator
  Loan Overpayment Calculator
 Mortgage Calculator
 Credit Card Calculator
 Investing
  Economics
 Trading
  Technical Analysis
  Personal Finance
 Calculator