Visa (NYSE:) Technical Analysis: Earnings in Focus as Bullish Momentum Builds
$364.68
28 Jul 2026, 15:59
Neutral

Join Minipip Academy and access free courses in investing, trading, economics, and more.
Sign Up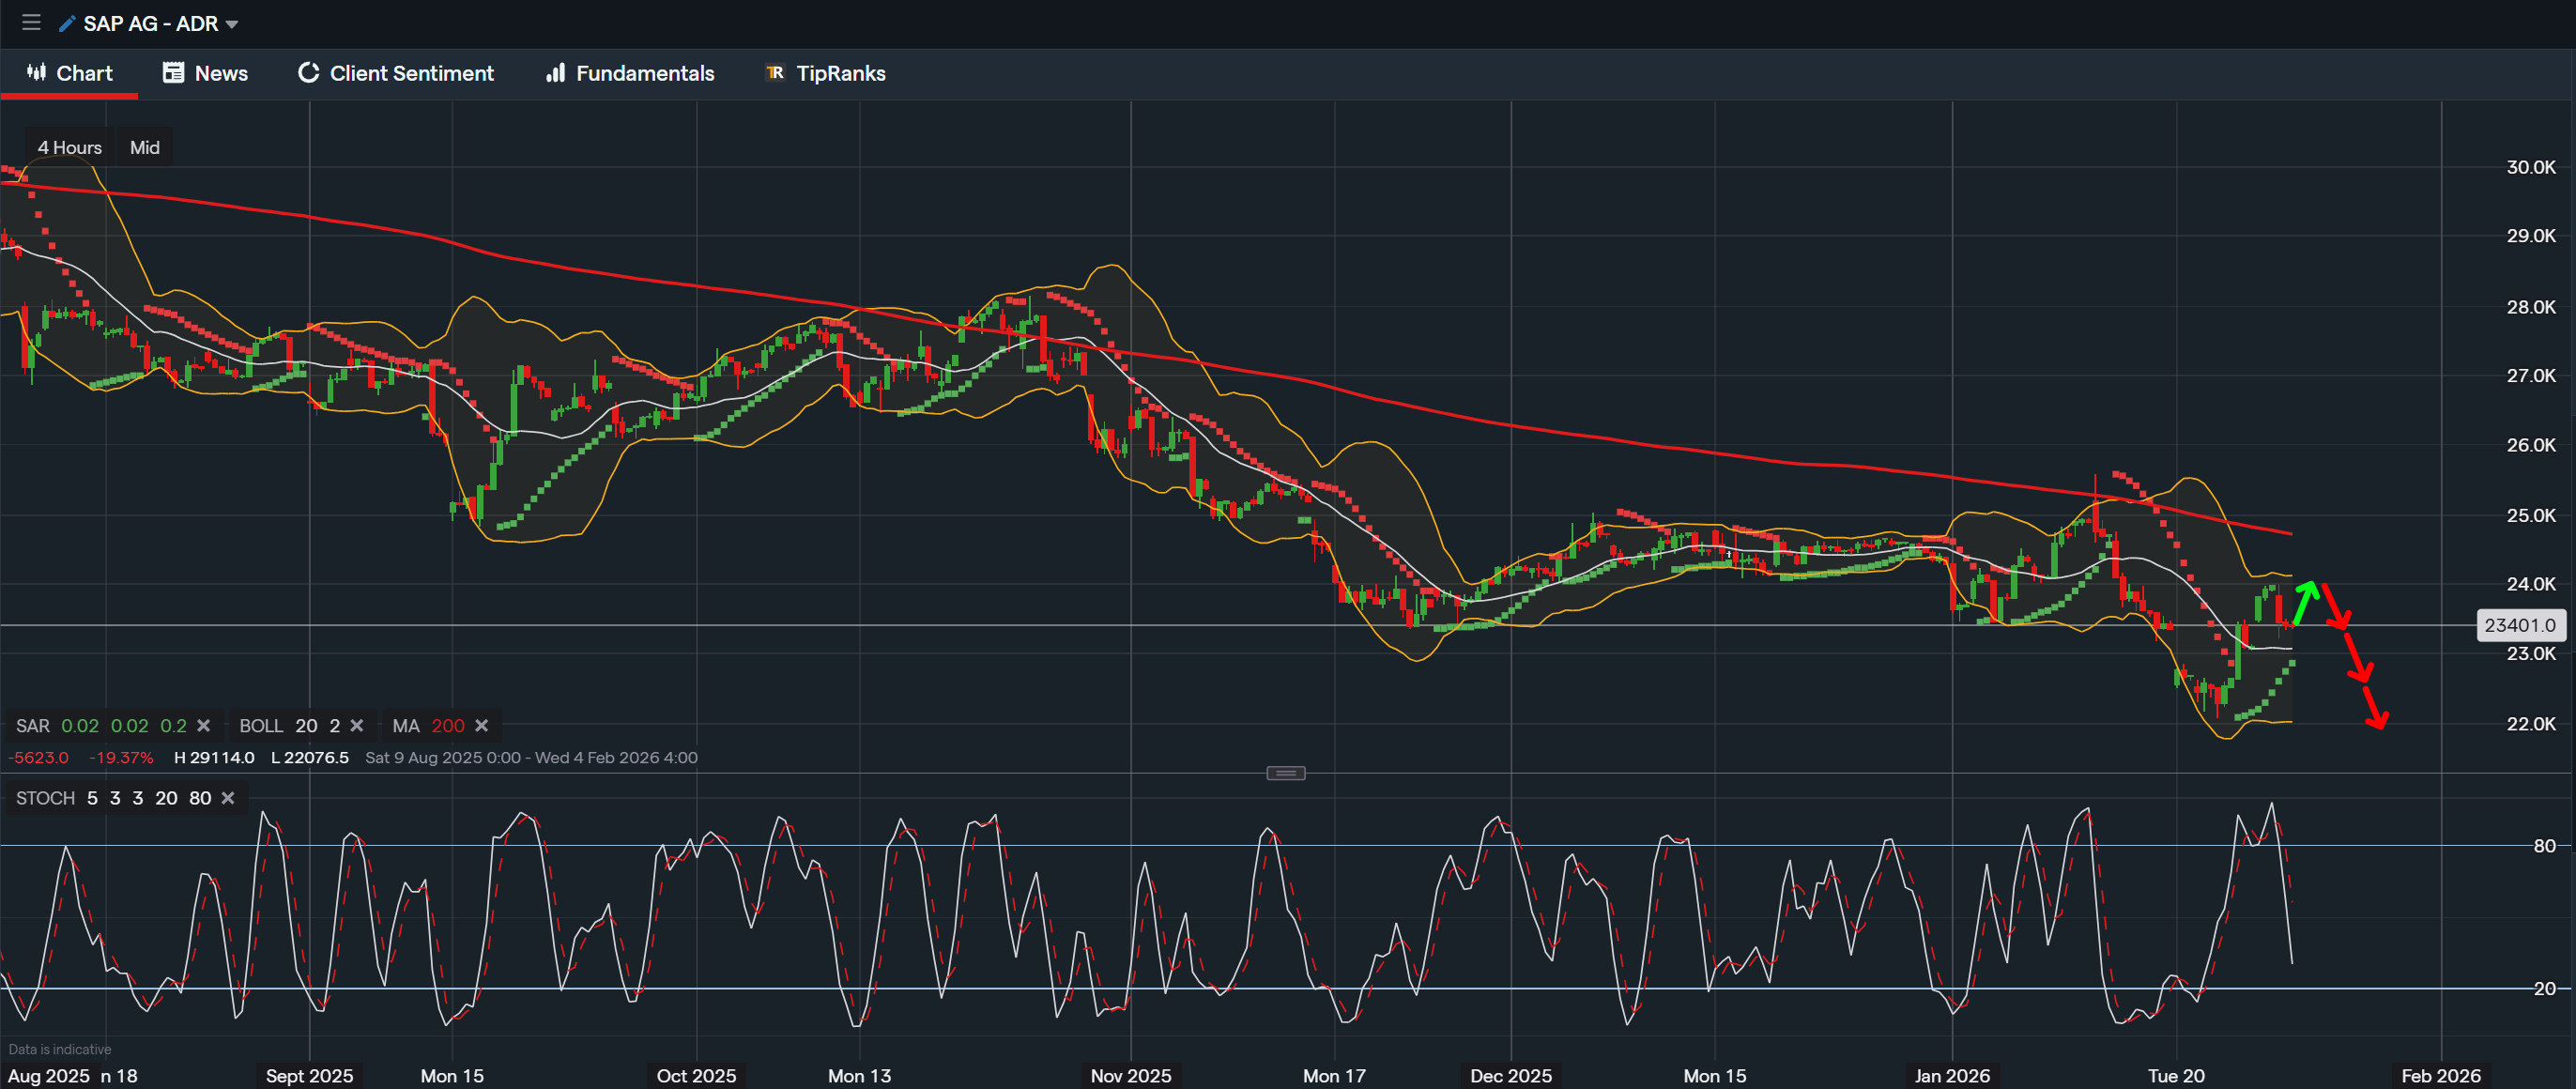
Data from IG - Timeframe - 4H
Market Overview
SAP is approaching an upcoming earnings release scheduled for Thursday, 29th January, which provides additional context to recent price behavior. The previous earnings per share figure was reported at $1.49, while current analyst estimates point toward an increase to approximately $1.76, representing an 18% year-on-year change. While this reflects an improvement in earnings expectations, the broader price performance of the stock tells a different story. Over the past year, SAP shares have declined by approximately 25.38%, indicating that downward pressure has remained the dominant theme despite incremental fundamental improvements.
On the 4-hour timeframe, price behavior suggests that earnings-related anticipation may align with a short-term reaction in price. Historically, similar setups have resulted in brief corrective movements within a broader trend rather than a structural shift in direction. As such, current price action appears to reflect short-term positioning rather than a change in the prevailing longer-term bias.
Valuation Metrics and Market Perception
From a valuation perspective, SAP is currently trading at a price-to-earnings ratio of 35.04, with a forward PE of 28.00. These figures indicate that future earnings growth remains priced into the stock, reflecting expectations of improved performance over time. However, valuation alone does not dictate price direction, particularly when broader market sentiment and technical structure remain under pressure.
Additionally, SAP’s current rating sits at 3, which remains below commonly referenced confidence thresholds used by market participants when assessing longer-term strength. This reading reflects subdued sentiment and suggests that market conviction has yet to improve meaningfully, even with forward-looking profitability metrics taken into account.
Trend Structure and Moving Average Analysis
From a technical standpoint, SAP continues to trade within a well-defined bearish structure on the 4-hour chart. Price remains consistently below the 200-period moving average, a widely observed indicator of longer-term trend direction. The 200 moving average has acted as dynamic resistance, with previous attempts to reclaim it resulting in renewed selling pressure.
The broader descending structure remains intact, with lower highs and lower lows continuing to define price action. This alignment reinforces the view that recent upward movements remain corrective in nature rather than indicative of a sustained directional shift.
Bollinger Bands and Volatility Conditions
Bollinger Band behavior provides additional insight into current market conditions. Price has recently approached the upper Bollinger Band, a zone that has historically coincided with short-term exhaustion within this trend. In previous instances on the chart, similar interactions with the upper band have been followed by a rotation back toward the midline or lower band, reflecting mean-reverting behavior within a declining channel.
This positioning suggests that volatility expansion to the upside has remained limited, with price continuing to respect the broader downward framework.
Momentum Signals and Oscillator Behavior
Momentum indicators further support the existing technical structure. The stochastic oscillator has begun to roll over from elevated levels and is now pointing lower, with momentum shifting back toward the 20 region. This transition often reflects a deceleration in upward momentum and a return to dominant trend conditions.
When viewed alongside price remaining below the 200 moving average and the broader trendline resistance, momentum readings currently align with continuation characteristics rather than reversal signals.
Conclusion
Overall, SAP’s 4-hour chart continues to reflect a bearish technical environment, with price structure, moving averages, volatility measures, and momentum indicators remaining aligned to the downside. While short-term fluctuations may occur around key events such as earnings releases, the prevailing technical framework has yet to show evidence of a sustained change in trend direction. Market behavior at present appears consistent with corrective movement occurring within a broader declining structure.
Disclaimer
This analysis is for informational purposes only and should not be considered financial advice. Investors and traders should conduct their own research and consider individual risk tolerance before making any investment decisions.

Tradable assets:
Min.Deposit:
Max Leverage:
FCA:

Rating:
 Earnings Calendar
  Economic Calendar
  VAT Calculator
  Tax Free Childcare Calculator
 Percentage Calculator
 Compound Interest Calculator
  Loan Overpayment Calculator
 Mortgage Calculator
 Credit Card Calculator
 Investing
  Economics
 Trading
  Technical Analysis
  Personal Finance
 Calculator


