Visa (NYSE:) Technical Analysis: Earnings in Focus as Bullish Momentum Builds
$364.68
28 Jul 2026, 15:59
Neutral

Join Minipip Academy and access free courses in investing, trading, economics, and more.
Sign Up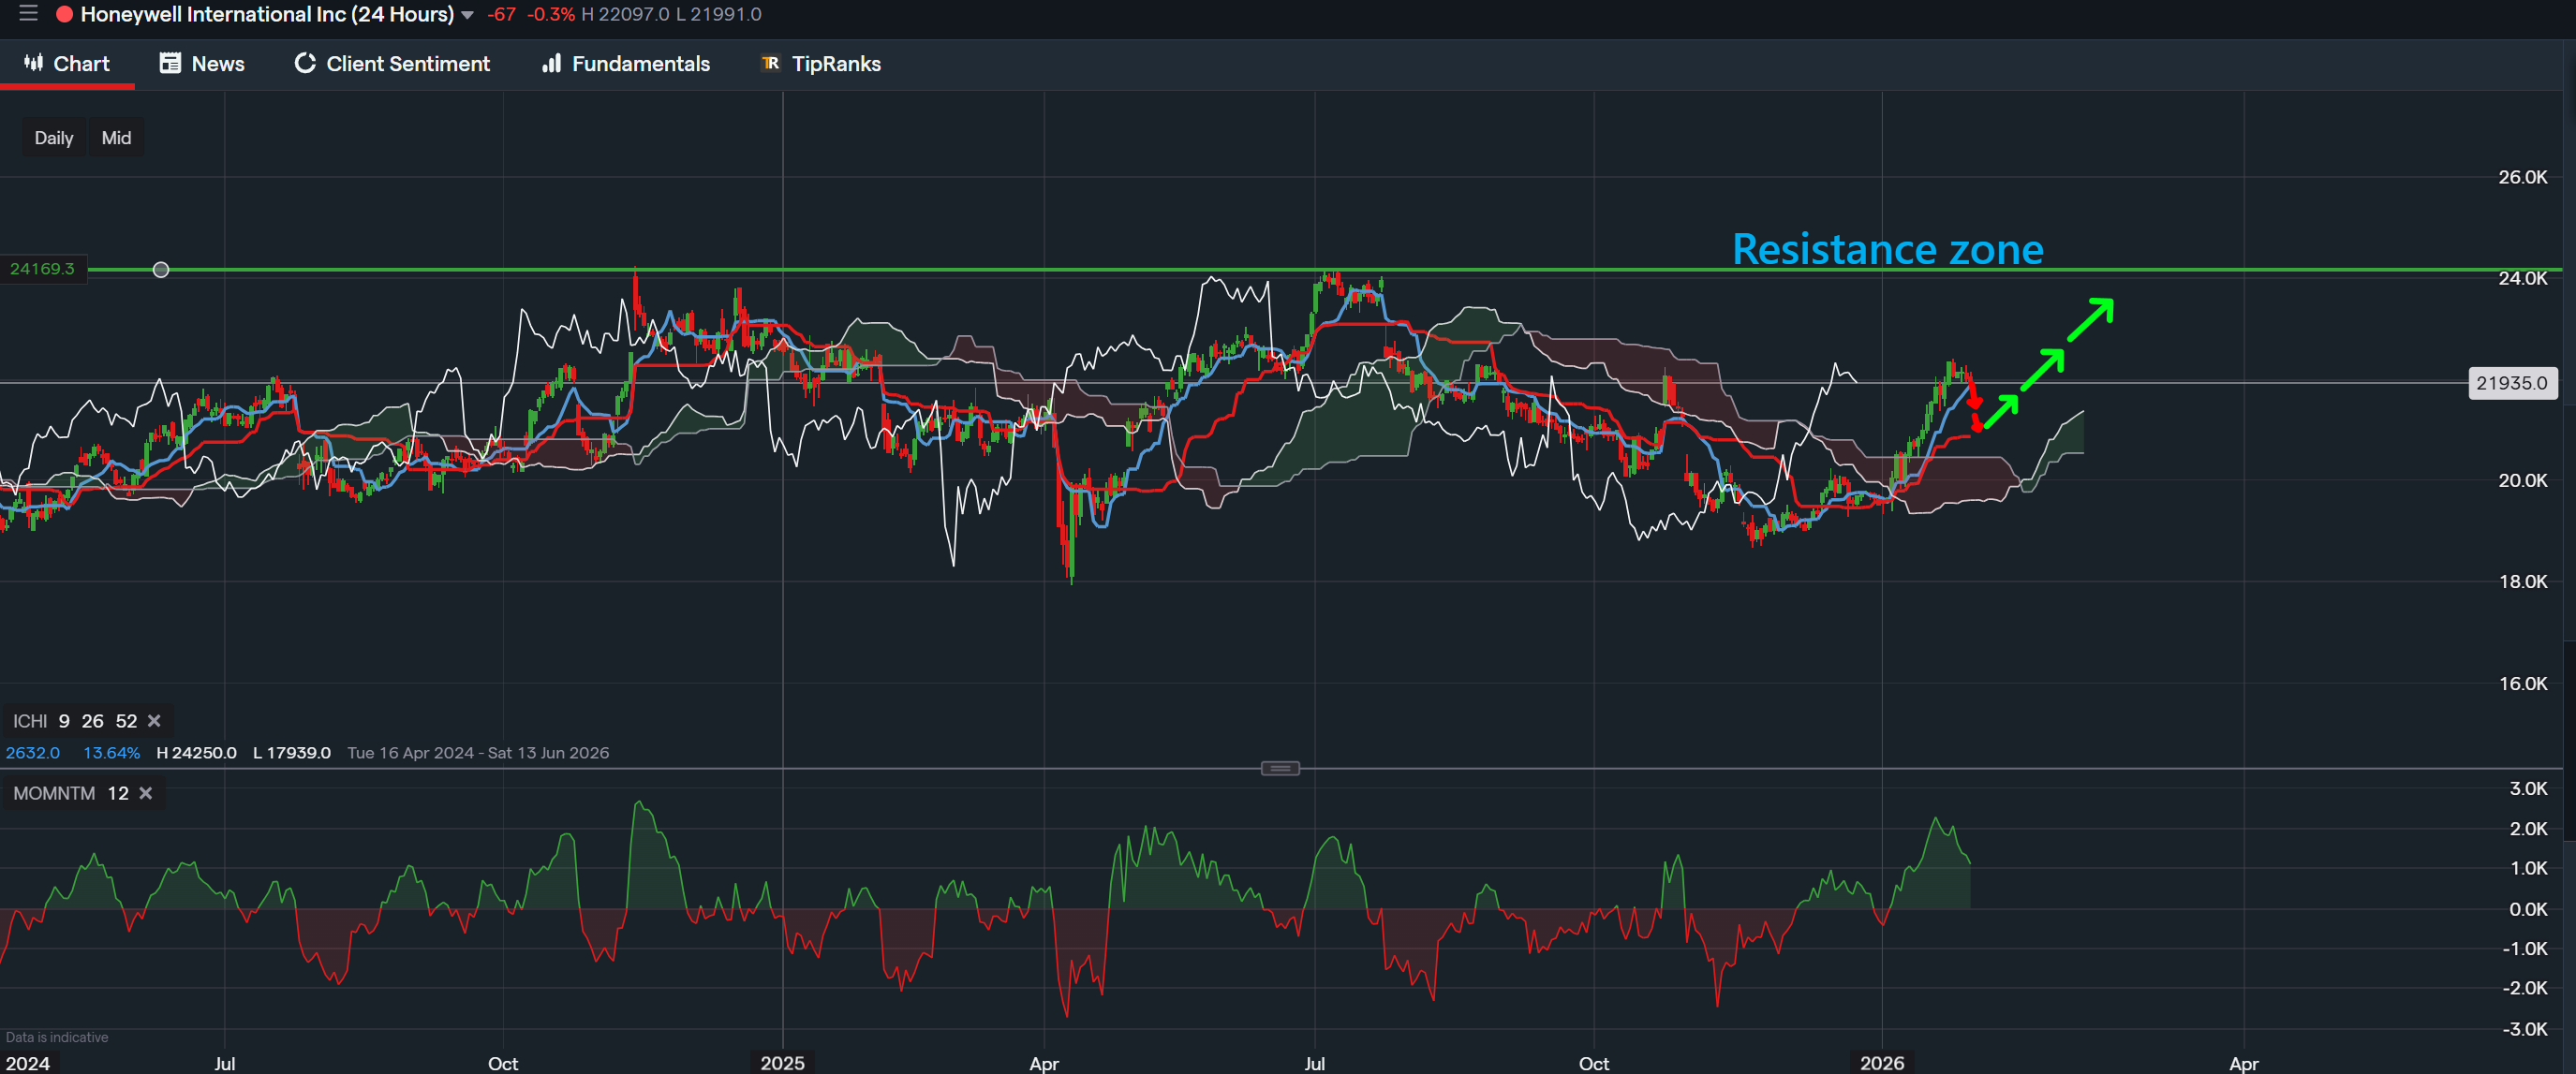
Data from IG - Timeframe - Daily
Market Overview
Honeywell International Inc continues to stand out as a large capitalisation industrial stock with strong institutional relevance. The company currently holds a TipRanks analyst rating score of 12, with the majority of analyst recommendations favouring the buy side. Although this rating remains below the higher-confidence threshold of 15 or above, it highlights measured optimism rather than outright bearish sentiment. This level of indecision is common in mature, fundamentally strong companies during transitional phases in market cycles.
From a valuation perspective, Honeywell remains fairly priced relative to both its sector and the broader market. The stock’s trailing price-to-earnings ratio is approximately 23.27, while the forward P/E has compressed to around 21.17. This forward contraction reflects expectations of continued earnings growth rather than excessive valuation expansion. With a market capitalisation near $140.25 billion, Honeywell maintains strong liquidity and long-term investment appeal for both institutional investors and technically driven market participants.
Earnings Outlook and Fundamental Expectations
Honeywell is scheduled to report earnings on 29 January. The previous earnings per share figure was reported at $2.47, while analyst consensus is currently forecasting an increase to approximately $2.53. This represents a modest year-on-year earnings growth of around 2.4%. When compared with the company’s historical year-on-year growth rate of approximately 6.24%, expectations appear more conservative.
This slowdown in projected growth often contributes to short-term price adjustments, particularly as markets reassess valuation ahead of confirmation. As a result, Honeywell may experience a brief retracement or consolidation phase around the earnings release before resuming its broader bullish trend. Such behaviour is consistent with structurally strong stocks that are pricing in expectations ahead of fundamental catalysts.
Daily Chart Structure and Ichimoku Cloud Analysis
On the daily timeframe, Honeywell continues to trade within a clearly defined bullish structure. Price action remains above the Ichimoku Cloud, confirming that trend bias remains firmly to the upside. The future cloud is projected green, providing additional confirmation that medium-term support remains intact and that bullish continuation remains the higher-probability scenario.
The Chikou Span is positioned well clear of historical price action, signalling minimal understanding resistance overhead. This separation reinforces trend strength and suggests that once momentum re-accelerates, price has room to advance without immediately encountering structural barriers.
Momentum Conditions and Short-Term Price Behaviour
Momentum on the daily chart remains positive and aligned with the prevailing trend, currently holding in bullish territory. However, a visible moderation in momentum suggests that buying pressure is temporarily easing. This does not indicate a trend reversal, but rather points toward a healthy corrective phase through either shallow pullbacks or sideways consolidation.
This momentum behaviour aligns well with the current price environment, particularly as Honeywell trades around the $220.91 region. Markets often pause near key levels ahead of earnings releases, allowing momentum to reset before the next impulsive move higher.
Key Resistance Zones and Price Outlook
Honeywell is currently approaching a well defined resistance zone near the $240.00 level. This area has historically acted as a supply zone and represents a logical upside target once bullish momentum strengthens. Holding above prior structural support and the Ichimoku Cloud remains critical in maintaining the current trend structure.
Should price consolidate above the $220.00 area and regain momentum, the probability increases for a continuation move toward resistance. A decisive daily close above the $240.00 zone would likely confirm trend continuation and open the door for further upside expansion.
Technical Summary
In summary, Honeywell International Inc remains technically bullish on the daily timeframe, supported by favourable Ichimoku Cloud alignment, a clear Chikou Span, and positive as though temporarily moderating momentum. Fundamentally, the stock continues to exhibit fair valuation metrics alongside steady earnings growth expectations.
While short term consolidation or a minor retracement remains possible ahead of earnings, the medium term outlook continues to favour upside continuation toward key resistance levels. Provided price remains supported above the cloud and maintains structure above $220.00, Honeywell remains well positioned to resume its broader bullish trajectory.
Disclaimer
This analysis is for informational purposes only and should not be considered financial advice. Investors and traders should conduct their own research and consider individual risk tolerance before making any investment decisions.

Tradable assets:
Min.Deposit:
Max Leverage:
FCA:

Rating:
 Earnings Calendar
  Economic Calendar
  VAT Calculator
  Tax Free Childcare Calculator
 Percentage Calculator
 Compound Interest Calculator
  Loan Overpayment Calculator
 Mortgage Calculator
 Credit Card Calculator
 Investing
  Economics
 Trading
  Technical Analysis
  Personal Finance
 Calculator


