UnitedHealth Group Analysis: Defensive Healthcare Scale Amid Regulatory and Margin Pressures
$407.34
12 Jun 2026, 17:06
Neutral

Join Minipip Academy and access free courses in investing, trading, economics, and more.
Sign Up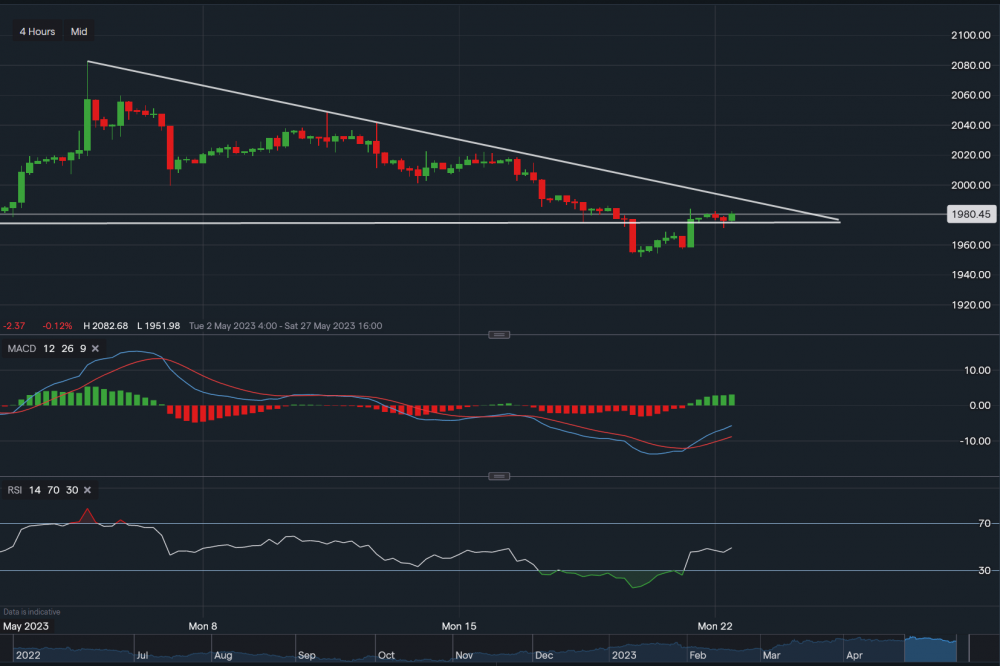
Chart & Data from IG
Gold dipped below its key support base on Thursday, which saw a slight rebound on Friday. The previous support of $1,974 is now acting as the support once more, followed by $1,957 and then $1,951. A break below $1,951 could see its price continue lower towards $1,935, and even as low as $1,900 an ounce. Towards the upside, resistance sits along the descending trendline of the triangle around $1,988. A break above it may see the price edge higher towards the $2,000 mark. But traders should be wary of any false breakouts as the current bias remains bearish. Over to the indicators, the MACD has turned positive on the 4 hourly timeframe with the RSI now in a neutral stance as it reads 48. However, on the daily timeframe, the MACD is still fairly negative so any upside movements can be limited. Unless there are clear signs of a reversal trend.

Tradable assets:
Min.Deposit:
Max Leverage:
FCA:

Rating:
 Earnings Calendar
  Economic Calendar
  VAT Calculator
  Tax Free Childcare Calculator
 Percentage Calculator
 Compound Interest Calculator
  Loan Overpayment Calculator
 Mortgage Calculator
 Credit Card Calculator
 Investing
  Economics
 Trading
  Technical Analysis
  Personal Finance
 Calculator


