UnitedHealth Group Analysis: Defensive Healthcare Scale Amid Regulatory and Margin Pressures
$407.34
12 Jun 2026, 17:06
Neutral

Join Minipip Academy and access free courses in investing, trading, economics, and more.
Sign Up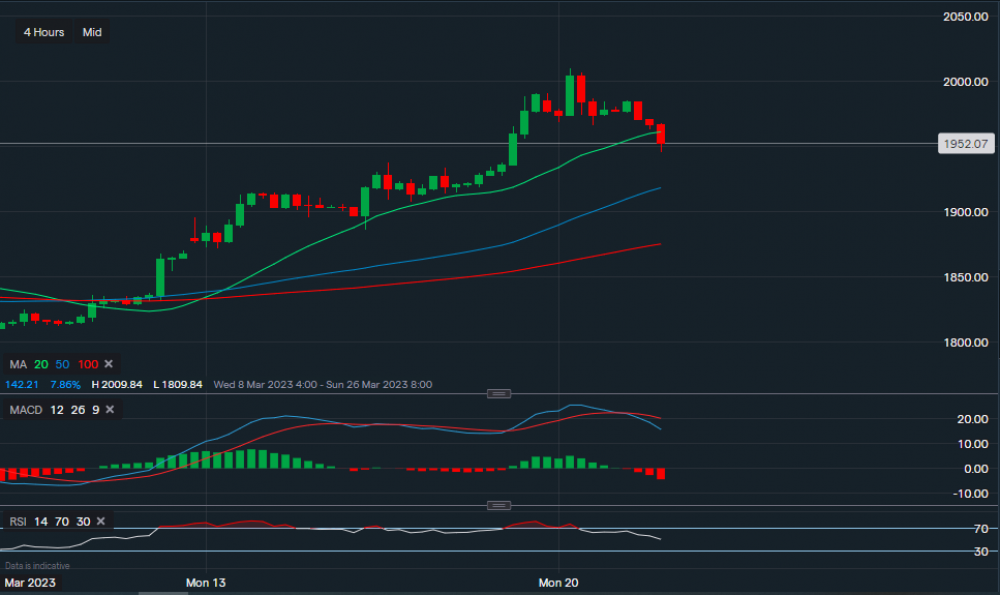
Chart & Data from IG
On the 4 hourly timeframe we can see that gold has now dipped below the 20-day moving average, or the support level of $1,960. The price of gold could now retrace further towards roughly $1,917, also the current position of the 50-day MA. A break below the 50-day MA may even see a further decline towards $1,874, which is the present position of the 100-day MA. However, the longer term outlook is still bullish, therefore, previous support of $1,960 is now acting as resistance. Followed by a level at $1,985, a break above this resistance level could see the price of gold head back up towards the 2023 high reached yesterday ($2,009). MACD has turned negative on the 4-hourly and RSI has faltered as it now reads 50, sitting in a neutral position after being overbought since last Friday till early Monday.
 Earnings Calendar
  Economic Calendar
  VAT Calculator
  Tax Free Childcare Calculator
 Percentage Calculator
 Compound Interest Calculator
  Loan Overpayment Calculator
 Mortgage Calculator
 Credit Card Calculator
 Investing
  Economics
 Trading
  Technical Analysis
  Personal Finance
 Calculator


