Visa (NYSE:) Technical Analysis: Earnings in Focus as Bullish Momentum Builds
$364.68
28 Jul 2026, 15:59
Neutral

Join Minipip Academy and access free courses in investing, trading, economics, and more.
Sign Up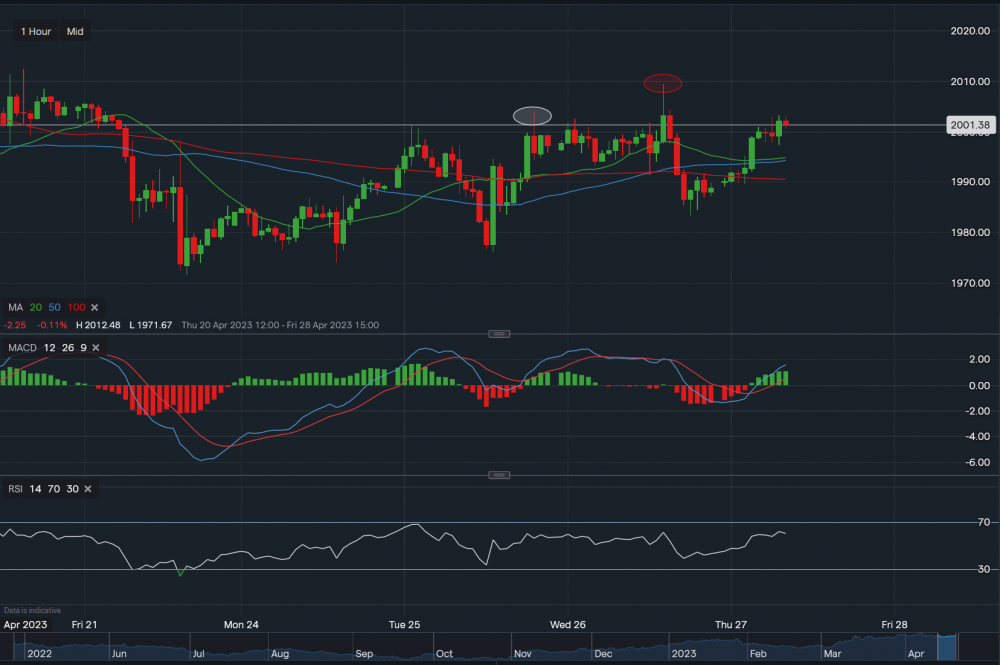
Chart & Data from IG
Taking a look at Gold as the commodity has been grinding its way higher, potentially gearing up for an upward breakout. Currently trading at around $2,001 an ounce with support levels below $1,994 (20 & 50-day moving averages) and then at $1,990 (100-day MA). A break below the 100-day MA could see the price slide further towards the support at $1,983. Towards the upside, gold faces tough resistance at $2,003 (white oval) followed by $2,009 (red oval). A move above $2,009 may see its price head higher with the target of around $2,020 an ounce. Looking at the technical indicators, MACD is positive and so is RSI as it reads 59.
 Earnings Calendar
  Economic Calendar
  VAT Calculator
  Tax Free Childcare Calculator
 Percentage Calculator
 Compound Interest Calculator
  Loan Overpayment Calculator
 Mortgage Calculator
 Credit Card Calculator
 Investing
  Economics
 Trading
  Technical Analysis
  Personal Finance
 Calculator


