Visa (NYSE:) Technical Analysis: Earnings in Focus as Bullish Momentum Builds
$364.68
28 Jul 2026, 15:59
Neutral

Join Minipip Academy and access free courses in investing, trading, economics, and more.
Sign Up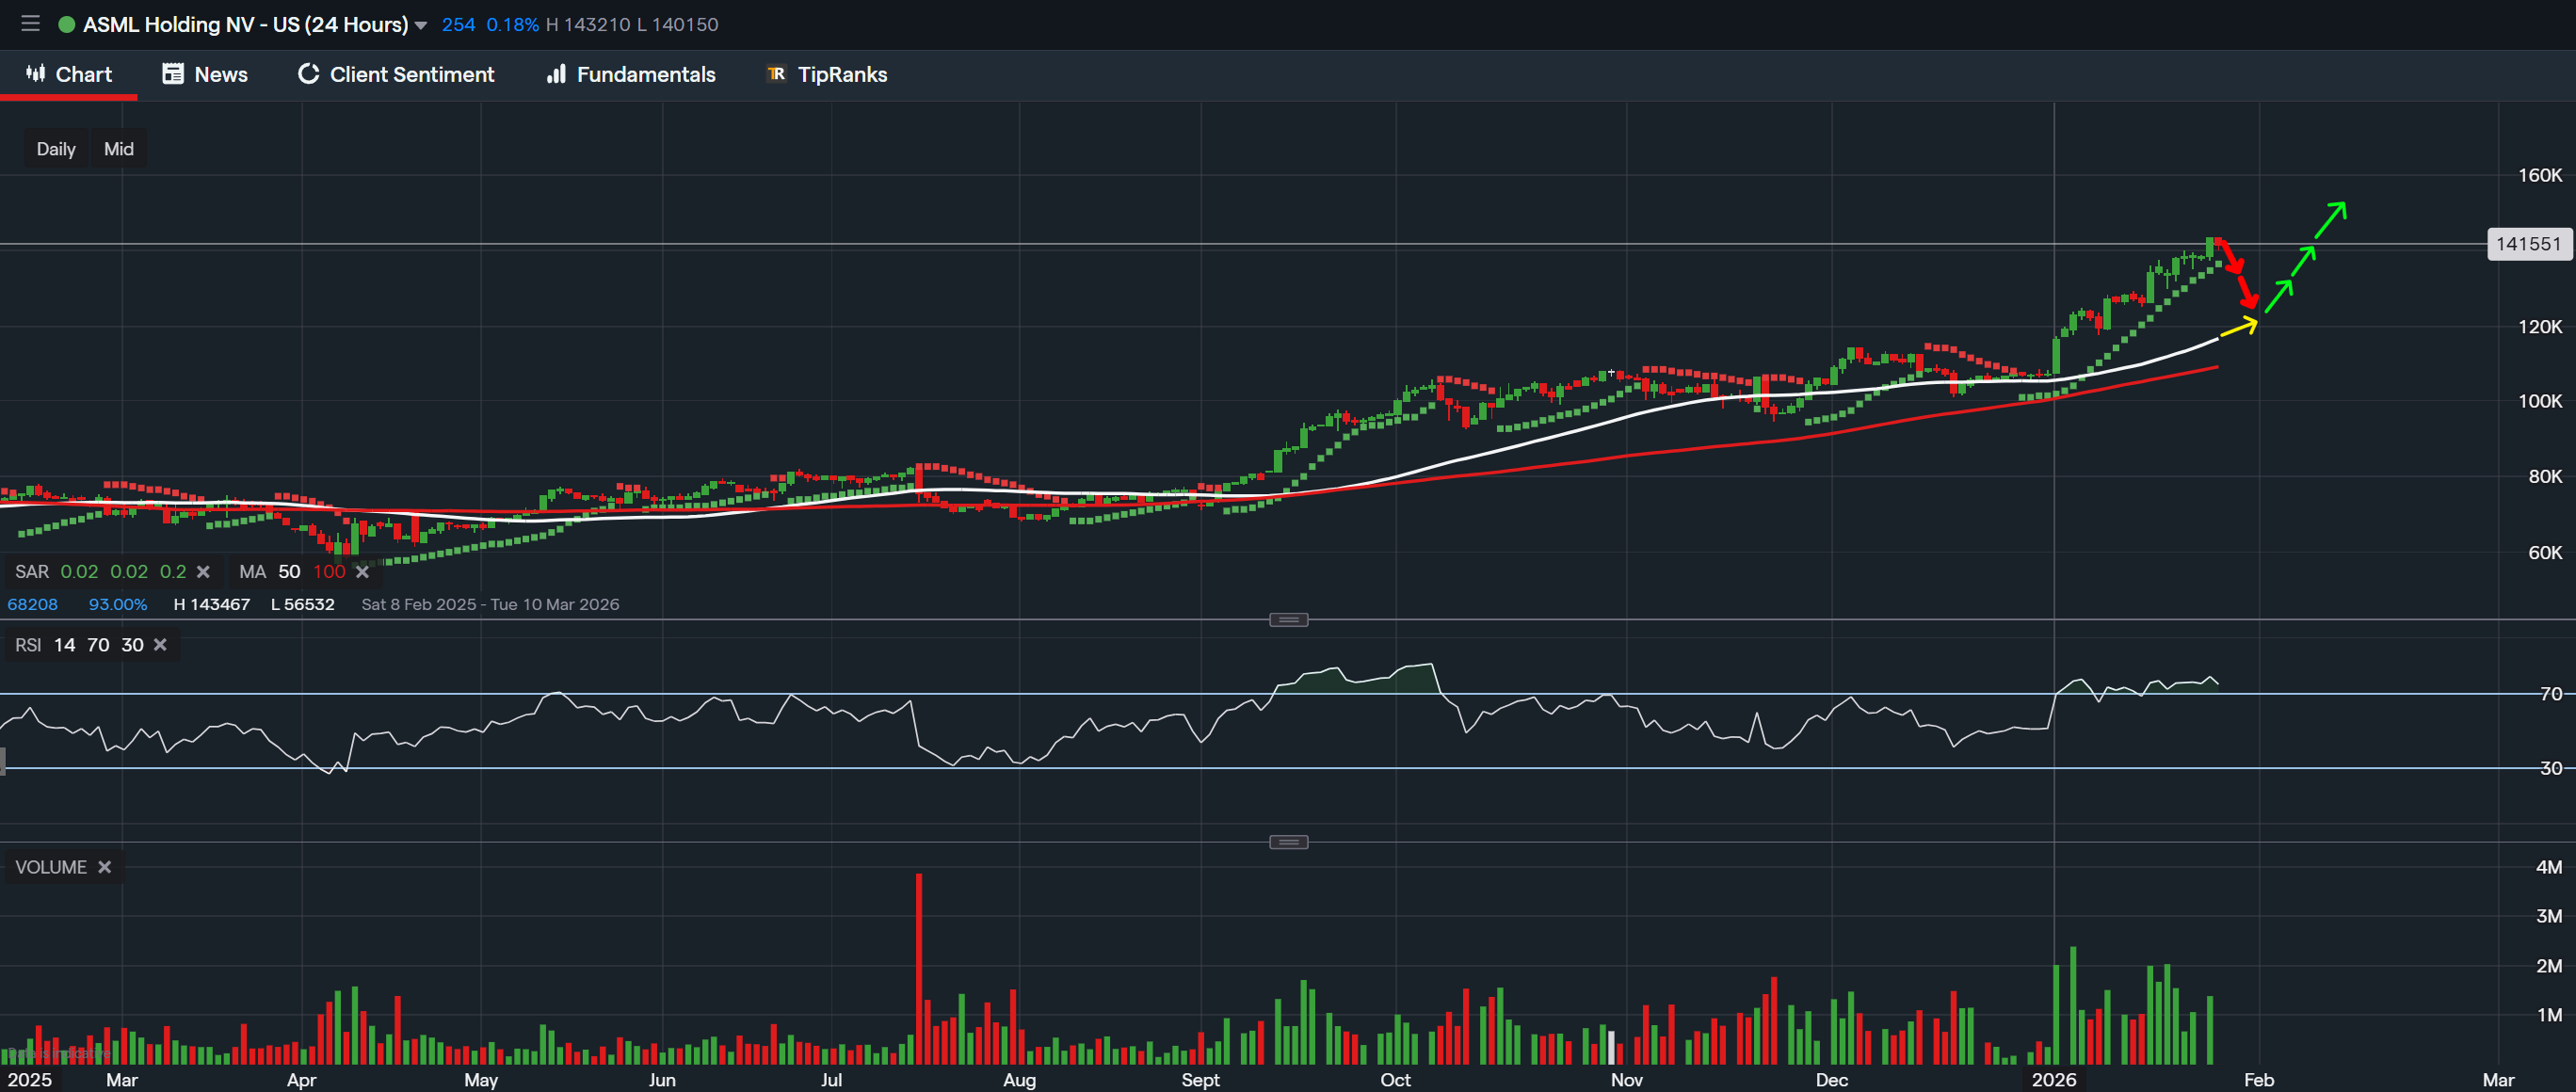
Data from IG - Timeframe - Daily
Market Overview
ASML Holdings continues to exhibit strong bullish momentum on the daily timeframe, confirming its position as one of the top-performing stocks in the semiconductor sector. The stock has been steadily climbing over recent months, demonstrating resilience even during minor market pullbacks. Currently, ASML is trading at a significant distance above its 50-day moving average, which is often a precursor to a short-term retracement. Technical patterns suggest that the stock is due for a corrective move, allowing the market to absorb recent gains and consolidate before attempting to push higher. The Relative Strength Index (RSI) is currently in overbought territory, indicating that while the overall trend remains bullish, a temporary pause in upward momentum is likely. Investors should watch for a red parabolic SAR dot above the candlestick, which will signal the beginning of this minor pullback. Once the retracement reaches a healthy support level around the 50-day moving average, ASML is expected to resume its bullish trajectory, presenting potential opportunities for both short-term traders and long-term investors.
Volume and Market Sentiment
The volume indicators on ASML’s chart reveal strong participation from buyers, suggesting high market confidence in the stock. Periods of increased volume often precede significant price moves, and the current trading activity reflects continued institutional interest and accumulation. This robust buying pressure is critical for sustaining the bullish momentum and mitigating the effects of any short-term retracement. Market sentiment remains overwhelmingly positive, supported by strong fundamentals in the semiconductor industry, including ongoing demand for advanced lithography equipment and ASML’s leadership in the EUV technology space. The combination of high volume and technical strength creates an ideal environment for a continuation of the upward trend once the temporary correction completes.
Technical Outlook and Key Levels
From a technical perspective, ASML appears to be forming a classic bullish continuation pattern. While a pullback toward the 50-day moving average is likely, this should not be interpreted as a reversal but rather as a natural consolidation within a larger uptrend. Key support levels to monitor include the 50-day moving average, which has historically acted as a strong foundation during previous retracements, and the 100-day moving average, which provides an additional layer of support in the event of a deeper correction. On the upside, if the stock successfully rebounds from the 50-day moving average, it could target previous highs around 145,000 USD, with potential for further gains toward the 160,000 USD range as bullish momentum accelerates. Traders should also pay attention to the parabolic SAR and RSI indicators for confirmation of trend continuation, while long-term investors may view any temporary dip as an opportunity to accumulate shares at a favorable price.
Conclusion
In summary, ASML Holdings remains in a strong bullish trend, supported by robust volume, favorable technical indicators, and a positive industry backdrop. While a short-term retracement toward the 50-day moving average is likely, this should be seen as a healthy pause in an otherwise upward trajectory. Investors and traders can expect the stock to resume its bullish momentum once the pullback completes, offering potential opportunities for both short-term gains and long-term growth. Continuous monitoring of support levels, volume trends, and key technical signals will be essential to maximize returns and manage risk effectively.
Disclaimer
This analysis is for informational purposes only and should not be considered financial advice. Investors and traders should conduct their own research and consider individual risk tolerance before making any investment decisions.

Tradable assets:
Min.Deposit:
Max Leverage:
FCA:

Rating:
 Earnings Calendar
  Economic Calendar
  VAT Calculator
  Tax Free Childcare Calculator
 Percentage Calculator
 Compound Interest Calculator
  Loan Overpayment Calculator
 Mortgage Calculator
 Credit Card Calculator
 Investing
  Economics
 Trading
  Technical Analysis
  Personal Finance
 Calculator


