Oracle Share Price Outlook: Could Oversold RSI Signal a Bullish Reversal?
$140.94
05 Jul 2026, 08:55
Bullish

Join Minipip Academy and access free courses in investing, trading, economics, and more.
Sign Up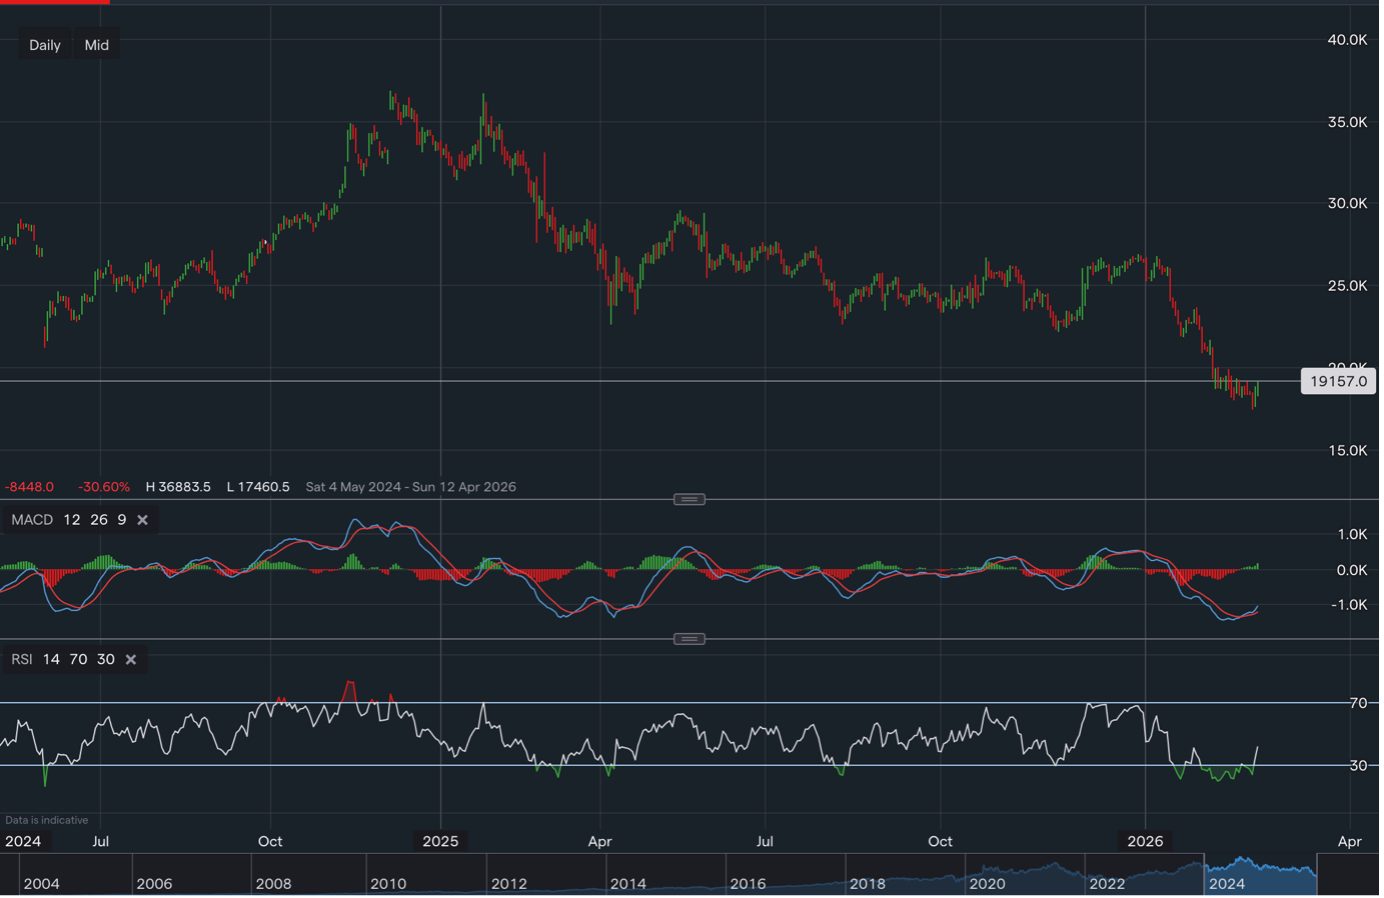
Salesforce (CRM) Stock Analysis 2026: Earnings Preview, Valuation Outlook & Price Prediction
Salesforce (traded on the NYSE under the ticker ‘CRM’) is a leading enterprise software provider specialising in CRM and cloud-based applications, currently trading at $189.85, with a market capitalisation of approximately $177.85B.
The company is undergoing a margin-expansion and cost-discipline phase following years of aggressive growth and acquisition-driven expansion (having acquired Slack, Tableau, Mulesoft and most recently Informatica).
Fundamental Outlook
The compression from a trailing PE of 25.33 to a forward of 14.43 implies substantial earnings acceleration embedded in consensus expectations.
Forward earnings imply approximately 70% expansion from TTM levels.
However, near-term data introduces tension:
This negative quarterly comparison contrasts sharply with the strong forward growth narrative.
With a forward PE at 14.4, CRM trades at a discount compared to its large-cap software peers, particularly if margin expansion can continue.
However, PEG at 1.05 suggests the stock is not undervalued relative to growth; rather, it seems fairly priced assuming consensus expectations materialise.
The valuation story, therefore, hinges on its ability to use leverage effectively, monetise AI traction and stabilise spending.
Salesforce has shifted towards profitability discipline and improving operating margins.
If revenue growth stabilises while cost structure remains efficient, earnings could compound faster and justify the forward multiple compression.
Analyst Sentiment
There is a wide dispersion of expectations amongst analysts:
However, there is a notable divergence in the price action, which reflects significantly more caution than analyst targets suggest.
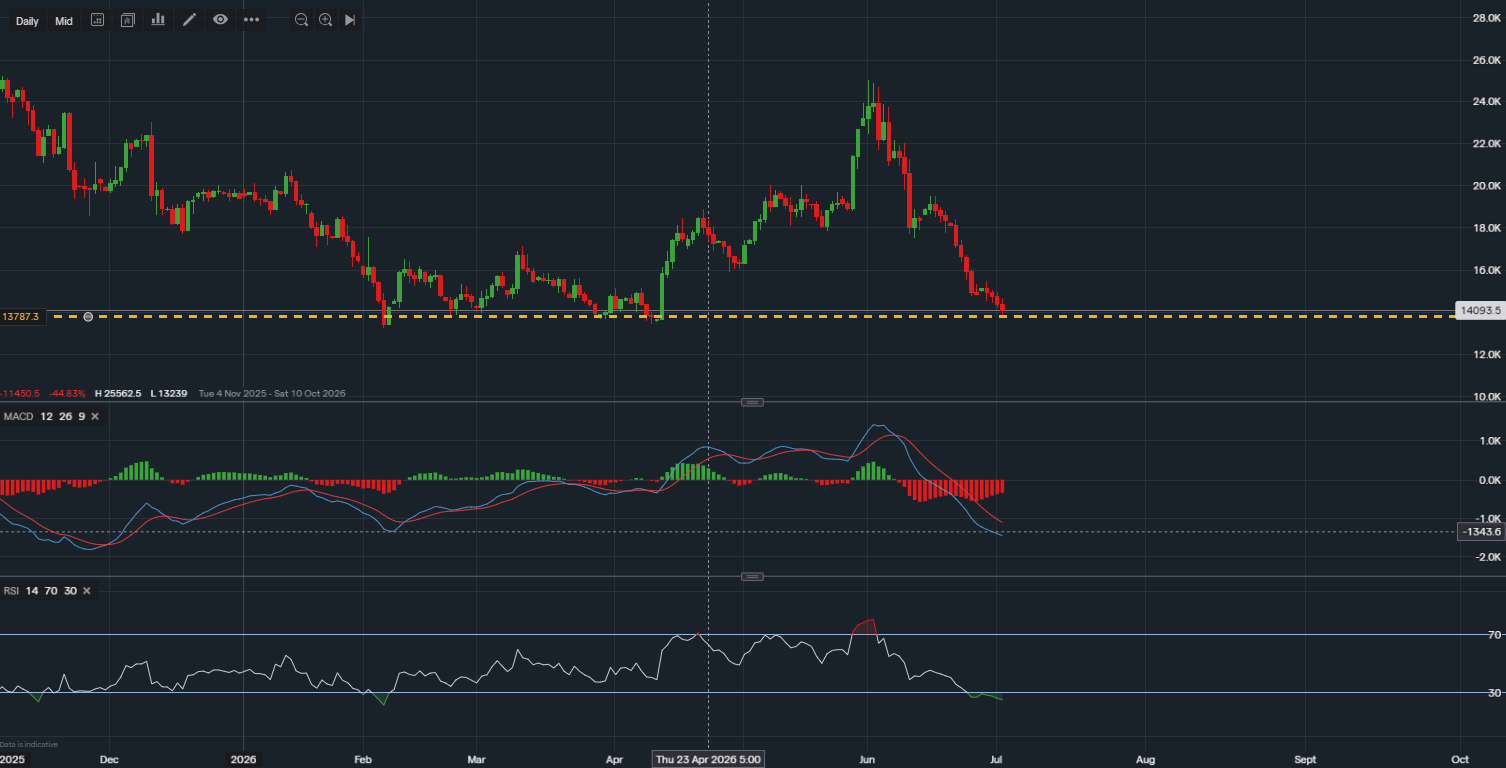
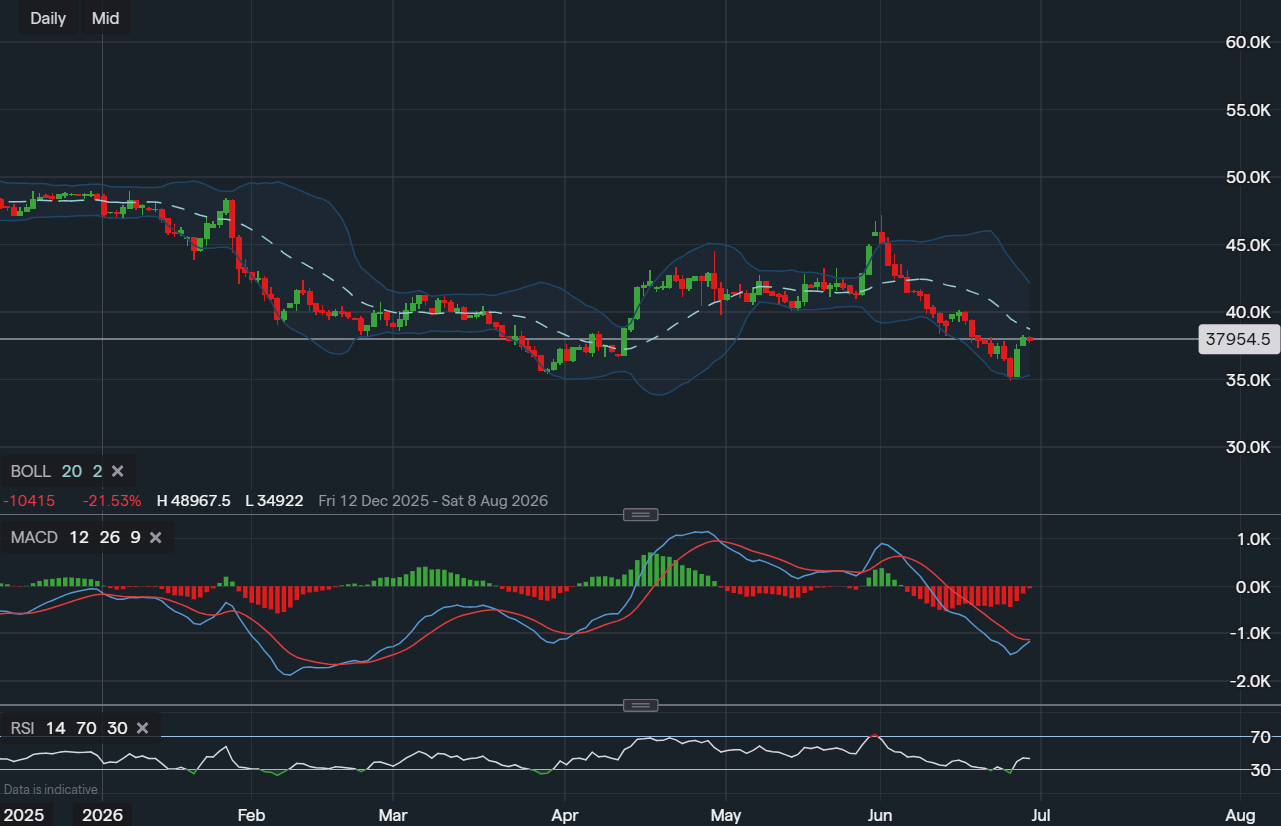
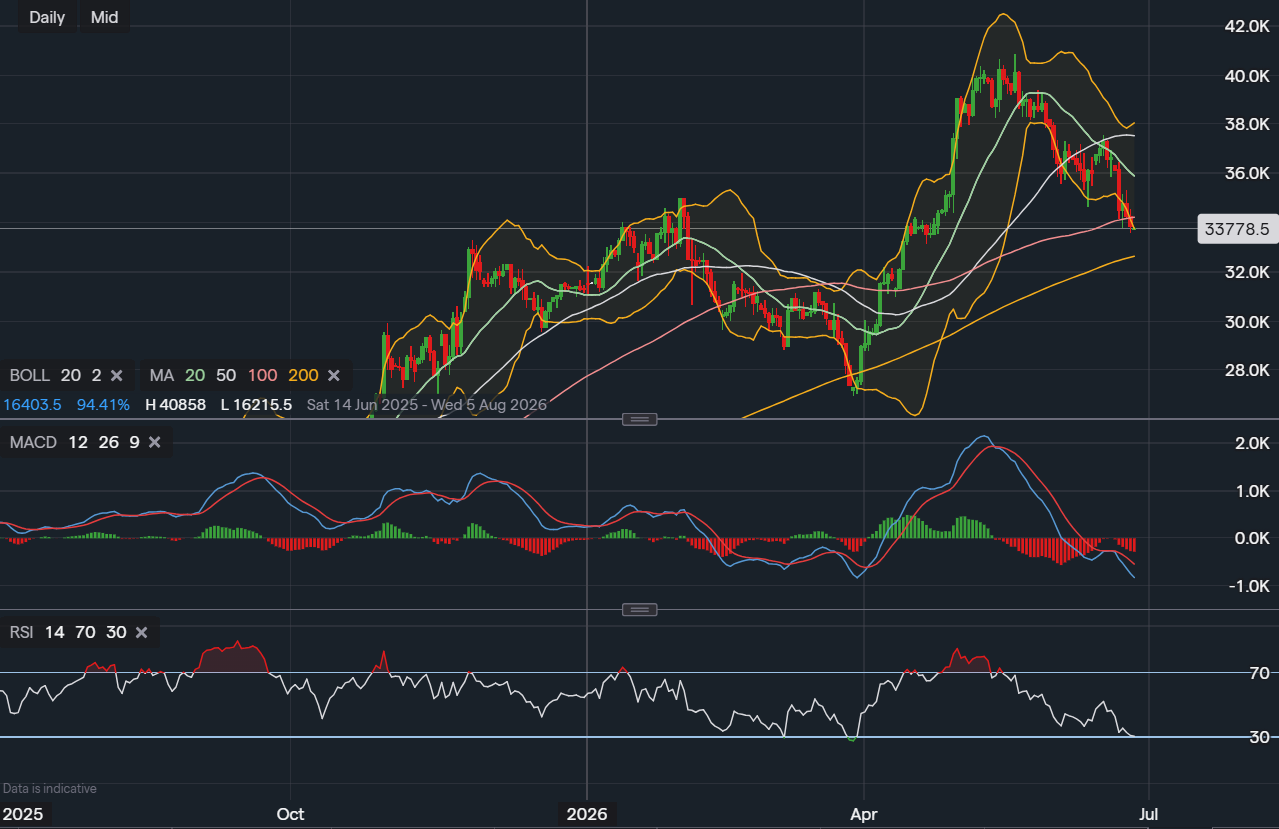
Technical Analysis
Trend Structure
Higher timeframe trend remains structurally bearish.
DMI / ADX
ADX above 40 confirms strong trend strength.
This is a structurally established downtrend.
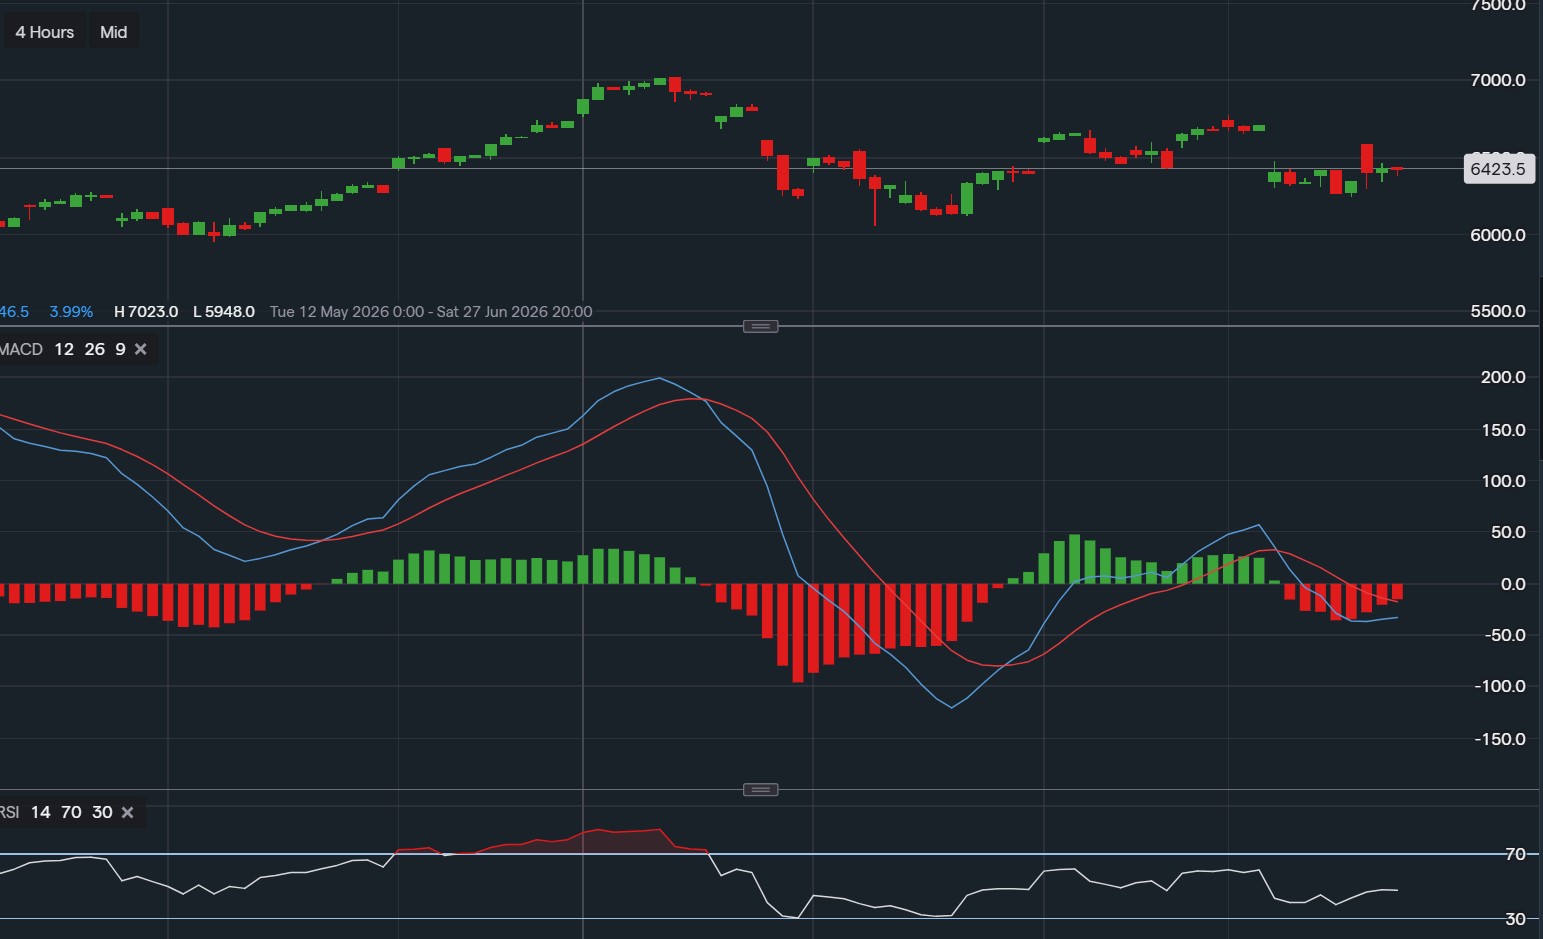
Momentum Signals
This suggests a potential short-term counter-trend and has yet to be confirmed as a full reversal, which may happen post-earnings release.
Volatility Profile
Volatility has already expanded; reported earnings may not require an extreme surprise to continue.
Key Levels
Current price: 189.85
Conclusion
The market is currently voting bearish via price action, despite optimistic analyst targets.
Forward valuation appears attractive only if earnings acceleration materialises. However, near-term YoY decline introduces uncertainty into the scenario.
Macro downtrend remains intact and the ADX confirms strong bearish trend strength.
Momentum divergence hints at a possible short-term bounce.
Earnings will determine whether forward growth expectations are validated or whether the structural downtrend continues.
At present, technical structure gives the edge to bears unless a strong catalyst emerges.
This content is for educational and informational purposes only and should not be considered financial advice. Always conduct independent research or consult a qualified financial professional before making investment decisions.

Tradable assets:
Min.Deposit:
Max Leverage:
FCA:

Rating:
 Earnings Calendar
  Economic Calendar
  VAT Calculator
  Tax Free Childcare Calculator
 Percentage Calculator
 Compound Interest Calculator
  Loan Overpayment Calculator
 Mortgage Calculator
 Credit Card Calculator
 Investing
  Economics
 Trading
  Technical Analysis
  Personal Finance
 Calculator