Oracle Share Price Outlook: Could Oversold RSI Signal a Bullish Reversal?
$140.94
05 Jul 2026, 08:55
Bullish

Join Minipip Academy and access free courses in investing, trading, economics, and more.
Sign Up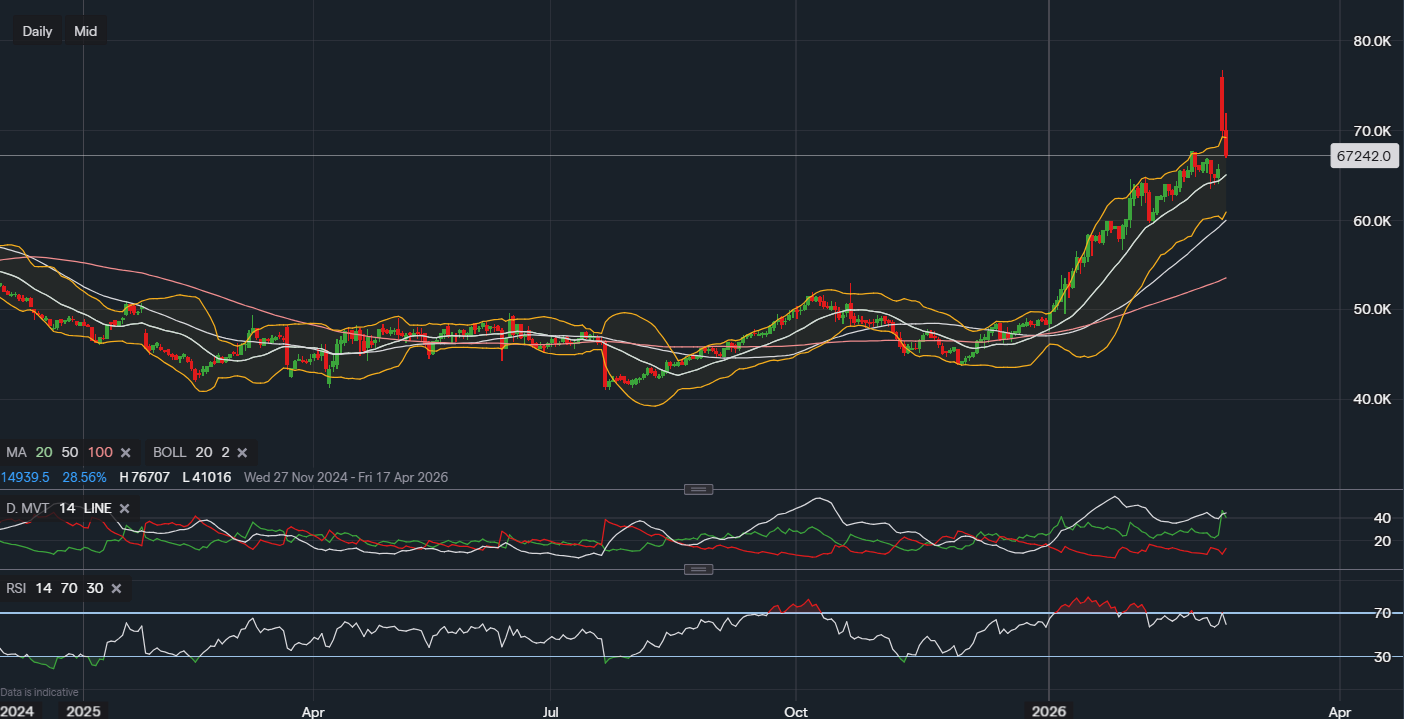
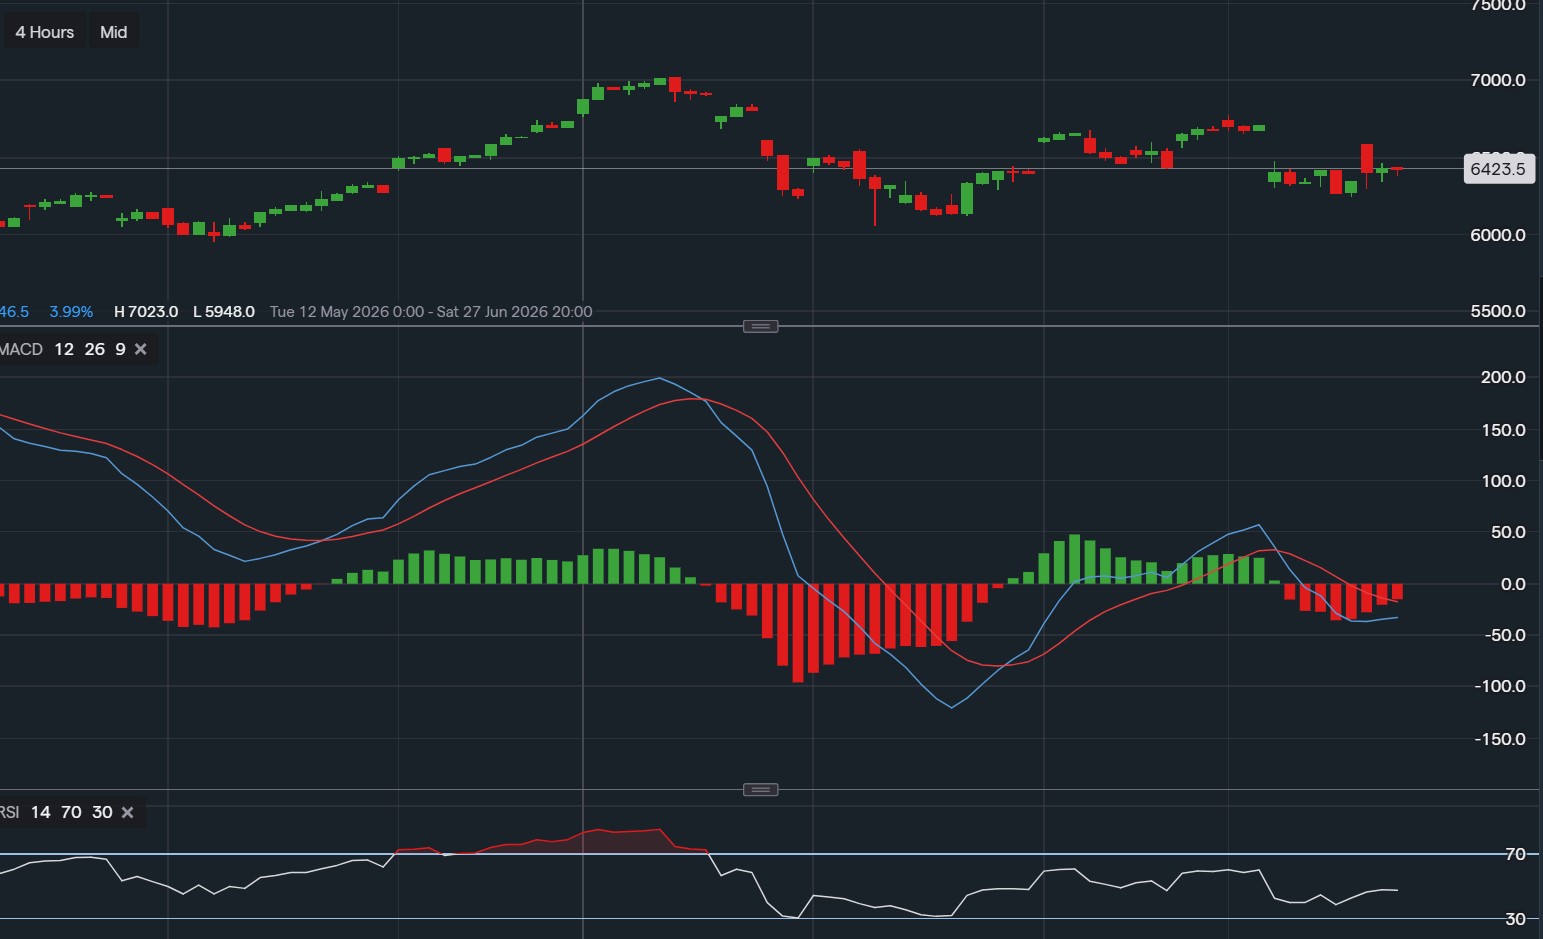
Northrop Grumman Stock Analysis (2026): Technical & Fundamental Outlook
Northrop Grumman is a leading American aerospace and defence technology company. It designs, builds and supports advanced systems used primarily by the United States government and allied nations for defence, space and national security.
Its core business segments include:
Stealth aircraft and long-range bombers
Unmanned aerial systems (drones)
Missile defence systems
Space systems and satellites
Cyber security and advanced radar technologies
As one of the world’s largest defence contractors, Northrop Grumman benefits from long-term government contracts and rising global defence expenditure.
Following recent geopolitical tensions involving Iran, Israel and the United States, investors have speculated about a potential escalation in military activity. Historically, periods of geopolitical uncertainty tend to benefit defence stocks, as markets anticipate increased government spending.
This sentiment has contributed to upward momentum in Northrop Grumman’s share price, with investors pricing in possible growth in defence contracts and revenue.
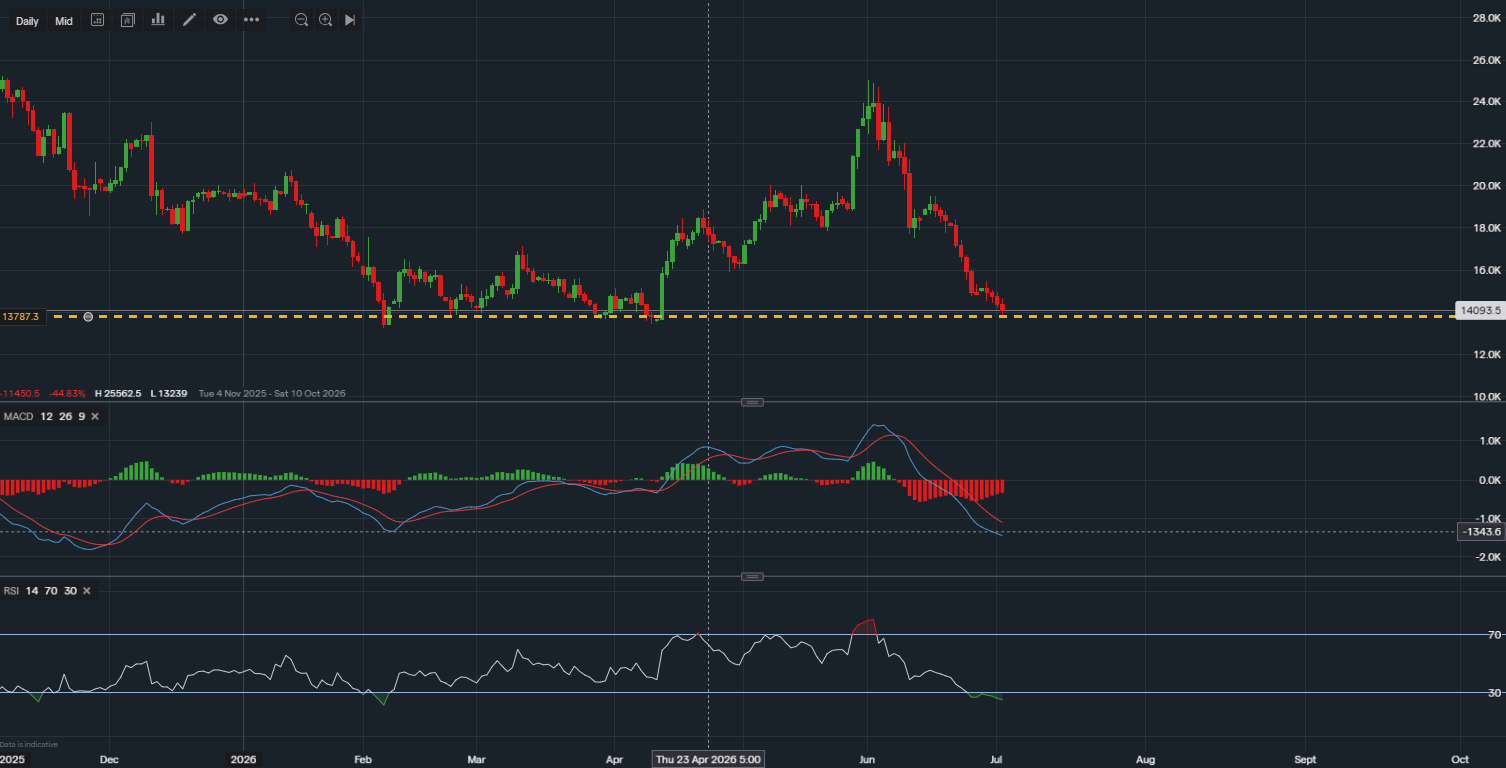
The RSI indicates that Northrop Grumman has been overbought, with readings above 70 for much of the past two months.
RSI above 70 = Overbought conditions
Extended overbought periods = Increased risk of pullback
This suggests caution for short-term traders.
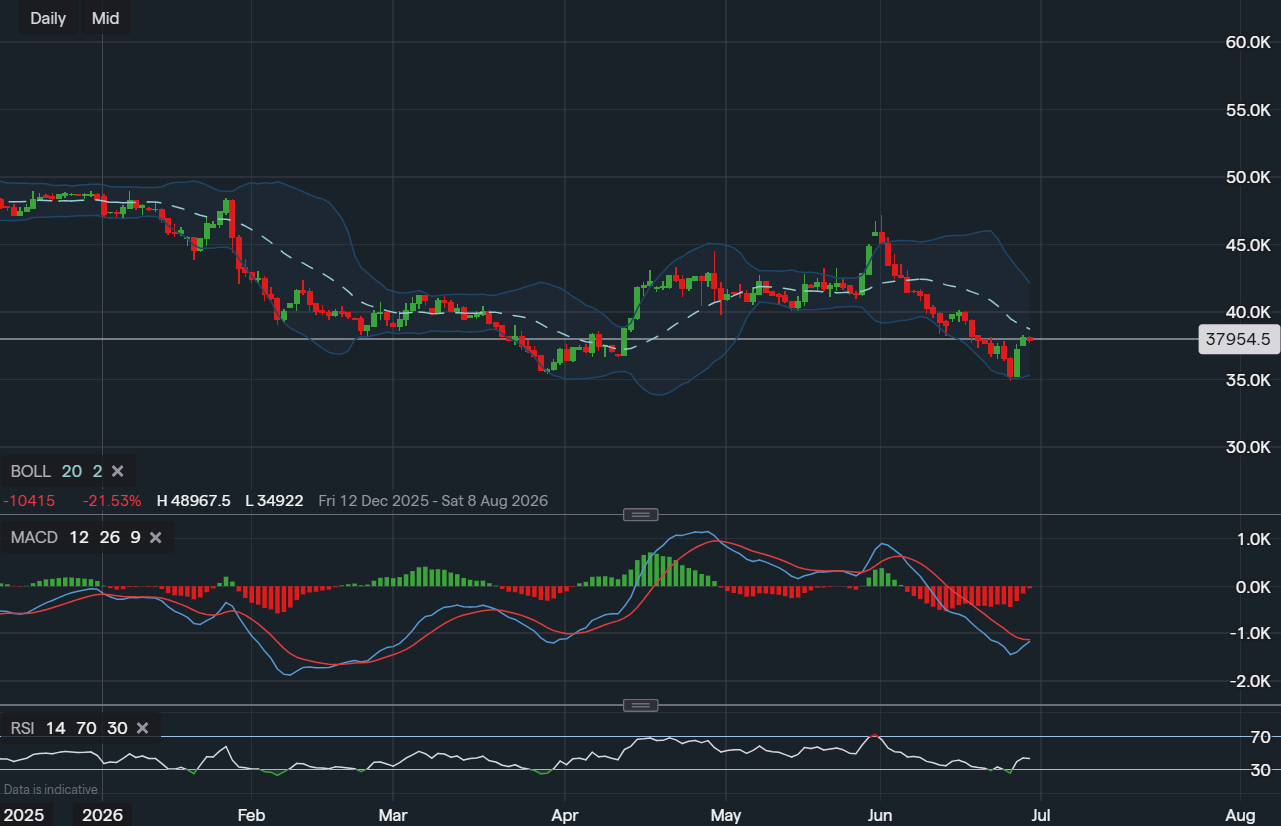
The current share price is trading above the upper Bollinger Band, which typically signals:
Heightened volatility
Strong buying pressure
Increased probability of mean reversion
Prices sustained above the upper band often precede consolidation or correction phases.
A gap up between 27 February and 1 March reflects strong bullish momentum. However, price gaps can increase volatility and are sometimes retraced, particularly if buying pressure weakens.
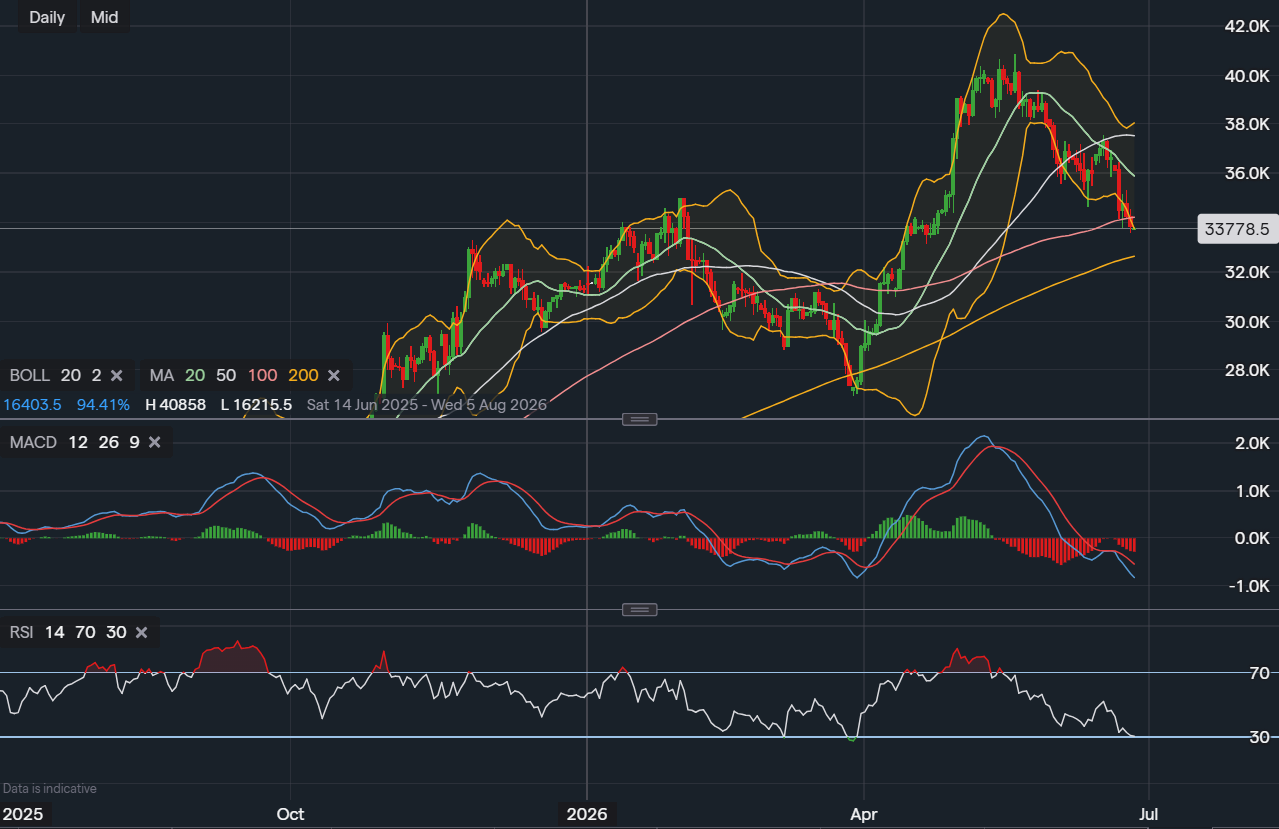
The Directional Movement Index currently reflects a strong bullish trend. A rising ADX above 25–30 generally confirms strengthening trend momentum.
This suggests that while technical indicators show overbought conditions, bullish momentum could continue in the near term.
Key dynamic support levels below the current share price include:
20-day exponential moving average (EMA)
50-day EMA
100-day EMA
These levels may provide support if a correction occurs.
Current P/E Ratio: 24.82
Forward P/E Ratio: 24.05
These valuation metrics suggest Northrop Grumman is trading at a relatively fair value compared to broader defence sector averages.
High target: $782.31 (3.20% upside)
Low target: $770.18 (1.60% upside)
The modest upside potential indicates that much of the expected earnings growth may already be priced into the stock.
RSI overbought conditions
Price above upper Bollinger Band
Recent gap up
Strong bullish DMI trend
Momentum may continue in the short term, but volatility risk remains elevated.
Stable government contracts
Strong defence sector positioning
Fair valuation metrics
However, limited implied upside suggests risk-reward may be constrained at current levels.
Despite geopolitical tailwinds and solid fundamentals, technical indicators suggest Northrop Grumman may be overextended in the short term. While upside potential exists, it appears limited based on current valuation metrics.
For traders, this may present a short-term momentum opportunity with strict risk management. For long-term investors, patience and a more favourable entry point may provide a stronger risk-reward profile.

Tradable assets:
Min.Deposit:
Max Leverage:
FCA:

Rating:
 Earnings Calendar
  Economic Calendar
  VAT Calculator
  Tax Free Childcare Calculator
 Percentage Calculator
 Compound Interest Calculator
  Loan Overpayment Calculator
 Mortgage Calculator
 Credit Card Calculator
 Investing
  Economics
 Trading
  Technical Analysis
  Personal Finance
 Calculator