Analysis
American Express (AXP) Stock Forecast: Technical Analysis Ahead of Earnings
$323.99
22 Oct 2026, 19:04
Neutral


Join Minipip Academy and access free courses in investing, trading, economics, and more.
Sign Up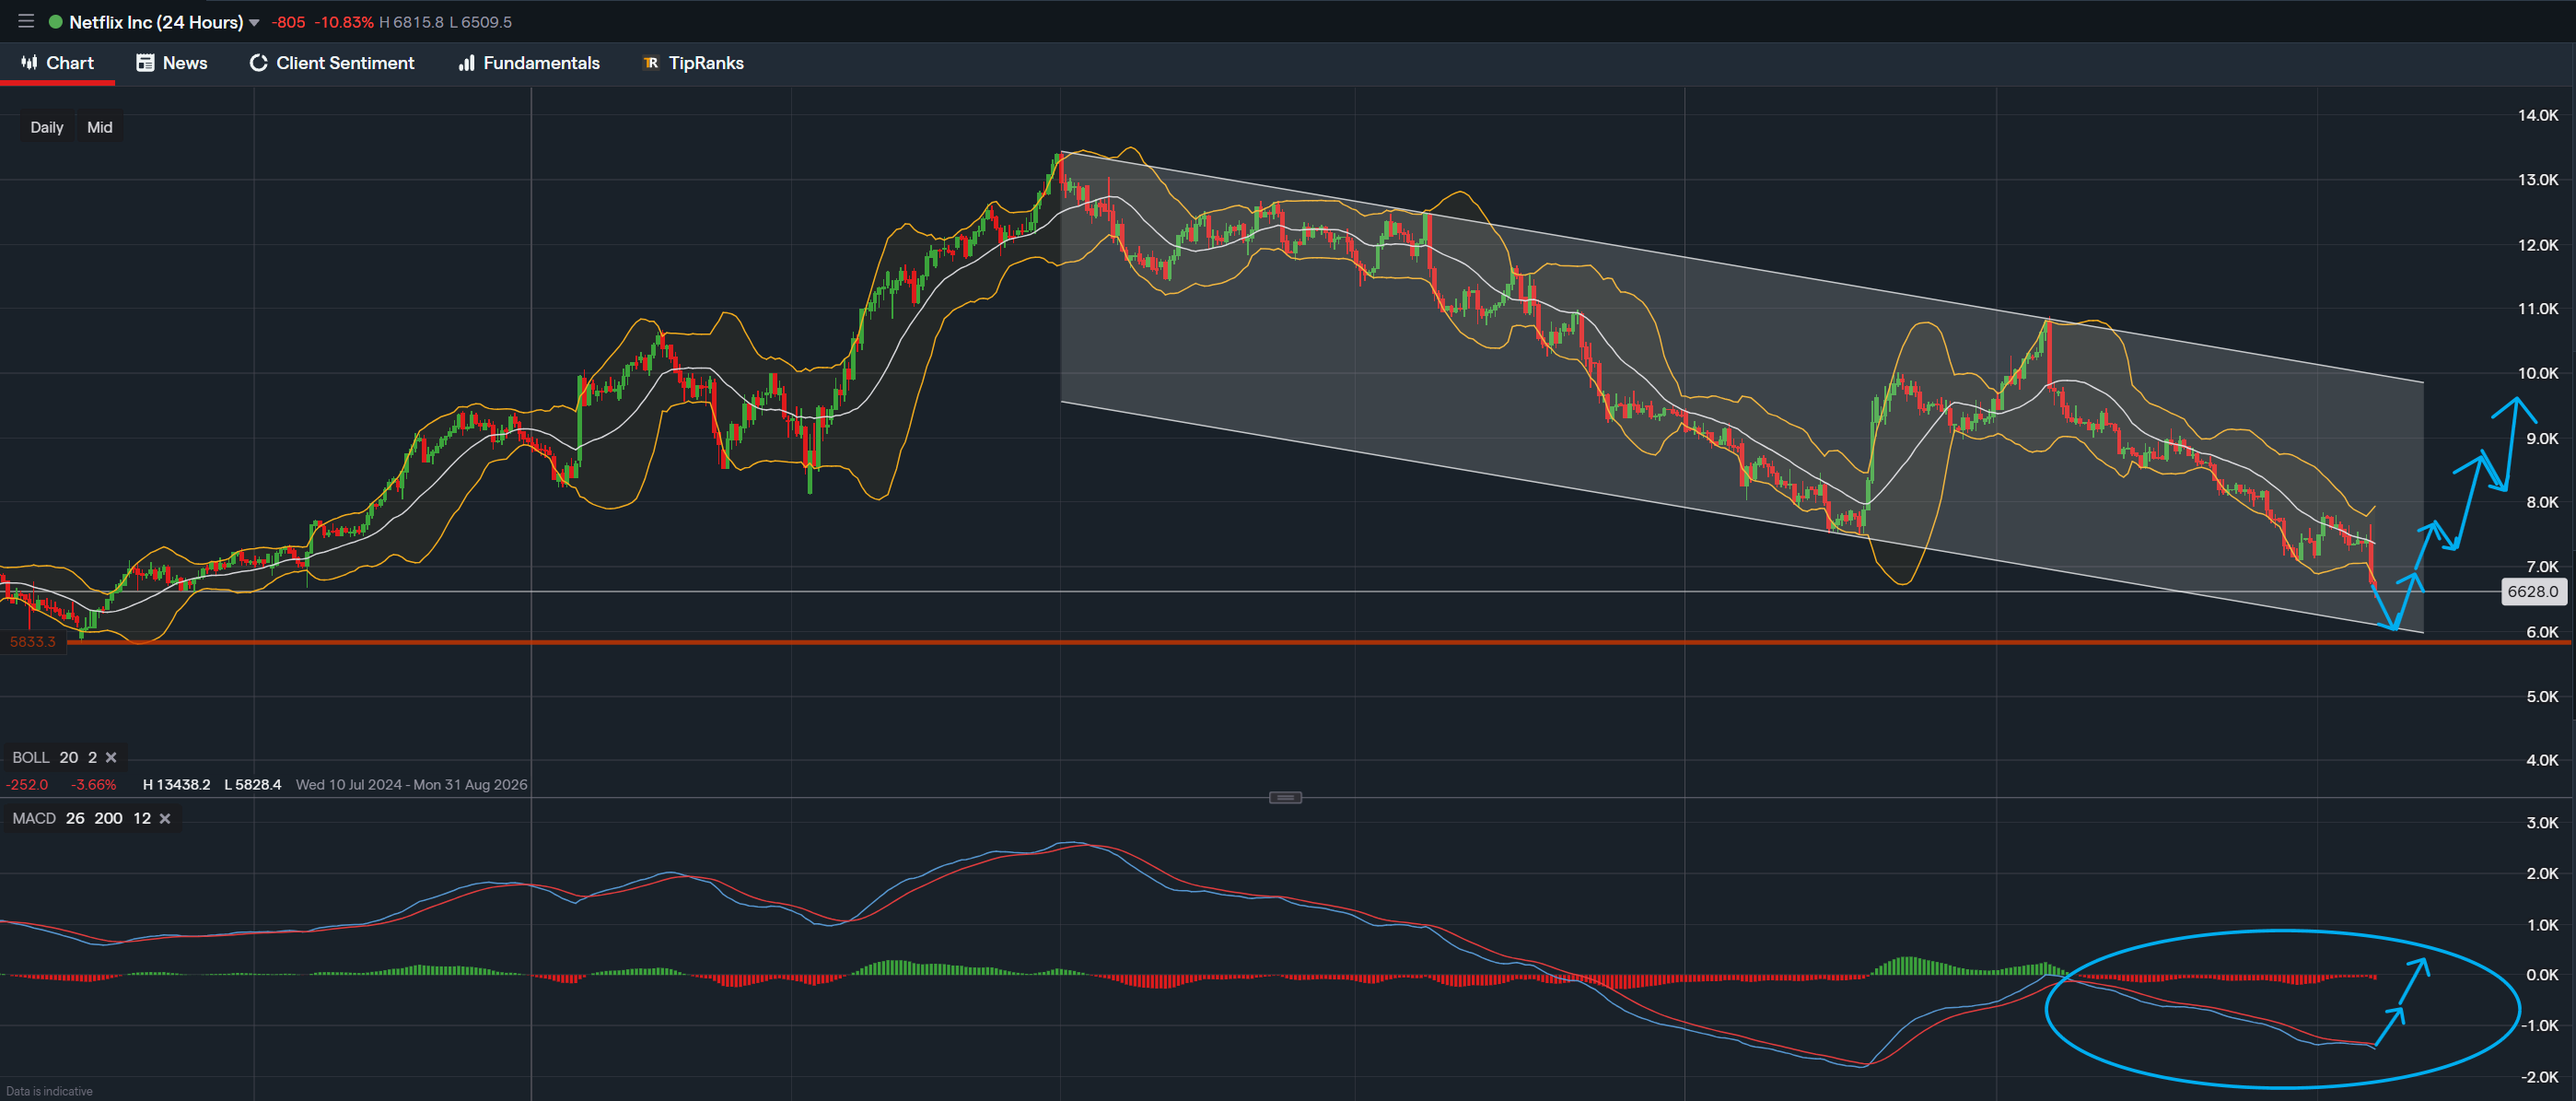
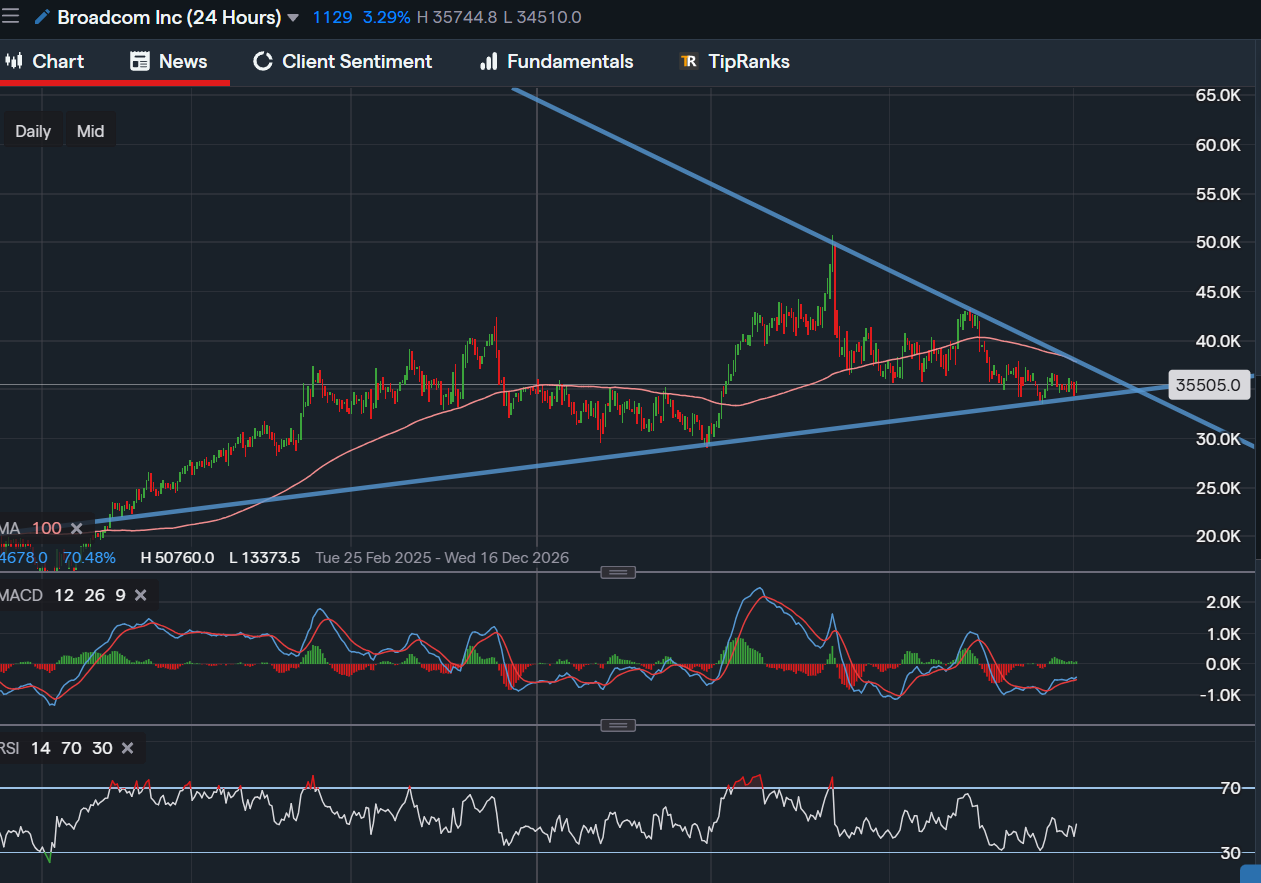
IG Data - Daily


Netflix continues to trade within a well-defined descending channel on the daily timeframe, suggesting that the prevailing short-term trend remains bearish despite the stock maintaining a stronger long-term upward trajectory. Recent price action has moved below the lower Bollinger Band, highlighting increased downside momentum and elevated market volatility rather than confirming a trend reversal.
From a technical perspective, the next significant area of interest is the major support level highlighted on the chart around the 6,000 price region (broker pricing). Should selling pressure continue, this level may attract buying interest. If buyers successfully defend this support and bullish price action begins to develop, price could attempt a recovery towards the upper boundary of the descending channel. Until then, the broader technical structure continues to favour the downside.
MACD Momentum Analysis
The Moving Average Convergence Divergence (MACD) remains below the zero line, indicating that bearish momentum continues to dominate the current market structure. However, the histogram appears to be gradually weakening, which may suggest that downside momentum is beginning to lose strength.
Market participants may wish to monitor for a bullish MACD crossover, where the MACD line moves above the signal line. While this alone would not confirm a sustained trend reversal, it could provide an early indication that buying momentum is beginning to return. Until such confirmation is observed, any upward movement may simply represent a short-term retracement within the existing downtrend.
Earnings Reaction and Market Sentiment
Although Netflix reported earnings that exceeded analysts' expectations on 16 July, the market reacted negatively, with the stock declining by approximately 8–9% during after-hours trading. This highlights the importance of forward guidance in determining market sentiment.
In many cases, financial markets place greater emphasis on future expectations than historical results. As a result, the decline appears to have been influenced more by management's outlook and future growth expectations than by the earnings figures themselves.
Long-Term Investment Perspective
From a longer-term perspective, analyst sentiment remains broadly constructive. According to TipRanks, Netflix continues to hold a Strong Buy consensus among analysts, reflecting confidence in the company's longer-term growth prospects despite recent short-term weakness.
Netflix also trades on a forward price-to-earnings (Forward P/E) ratio that is lower than its current trailing P/E ratio. While valuation metrics should not be interpreted as predictors of future performance, they may indicate that analysts expect earnings growth over the coming year. These metrics are generally most useful when considered alongside broader market conditions, company fundamentals and future earnings updates.
Technical Outlook
Based solely on the current technical structure, the chart continues to favour bearish price action while Netflix remains within the descending channel. A sustained move towards the identified support level could become an area of interest, particularly if accompanied by evidence of strengthening buying pressure or improving momentum indicators.
Conversely, a decisive break below support could suggest that sellers remain in control and may increase the probability of further downside. Alternatively, a successful rebound from support followed by a break above the descending channel could improve the technical outlook and indicate that bullish momentum is beginning to strengthen. As with all technical analysis, these scenarios remain conditional and depend on future price action.
Conclusion
Netflix remains fundamentally strong over the longer term, while its current daily chart reflects continued short-term bearish pressure. Technical indicators currently suggest that market participants may wish to monitor key support levels, momentum indicators and future earnings developments for additional confirmation before drawing conclusions about the next directional move.
It is important to recognise that technical analysis is based on probabilities rather than certainties. Market conditions can change rapidly, and no technical indicator or chart pattern guarantees future price movements.
Disclaimer
This analysis is for informational purposes only and should not be considered financial advice. Investors and traders should conduct their own research and consider individual risk tolerance before making any investment decisions.

Tradable assets:
Min.Deposit:
Max Leverage:
FCA:

Rating:
 Earnings Calendar
  Economic Calendar
  VAT Calculator
  Tax Free Childcare Calculator
 Percentage Calculator
 Compound Interest Calculator
  Loan Overpayment Calculator
 Mortgage Calculator
 Credit Card Calculator
 Investing
  Economics
 Trading
  Technical Analysis
  Personal Finance
 Calculator