Analysis
American Express (AXP) Stock Forecast: Technical Analysis Ahead of Earnings
$323.99
22 Oct 2026, 19:04
Neutral


Join Minipip Academy and access free courses in investing, trading, economics, and more.
Sign Up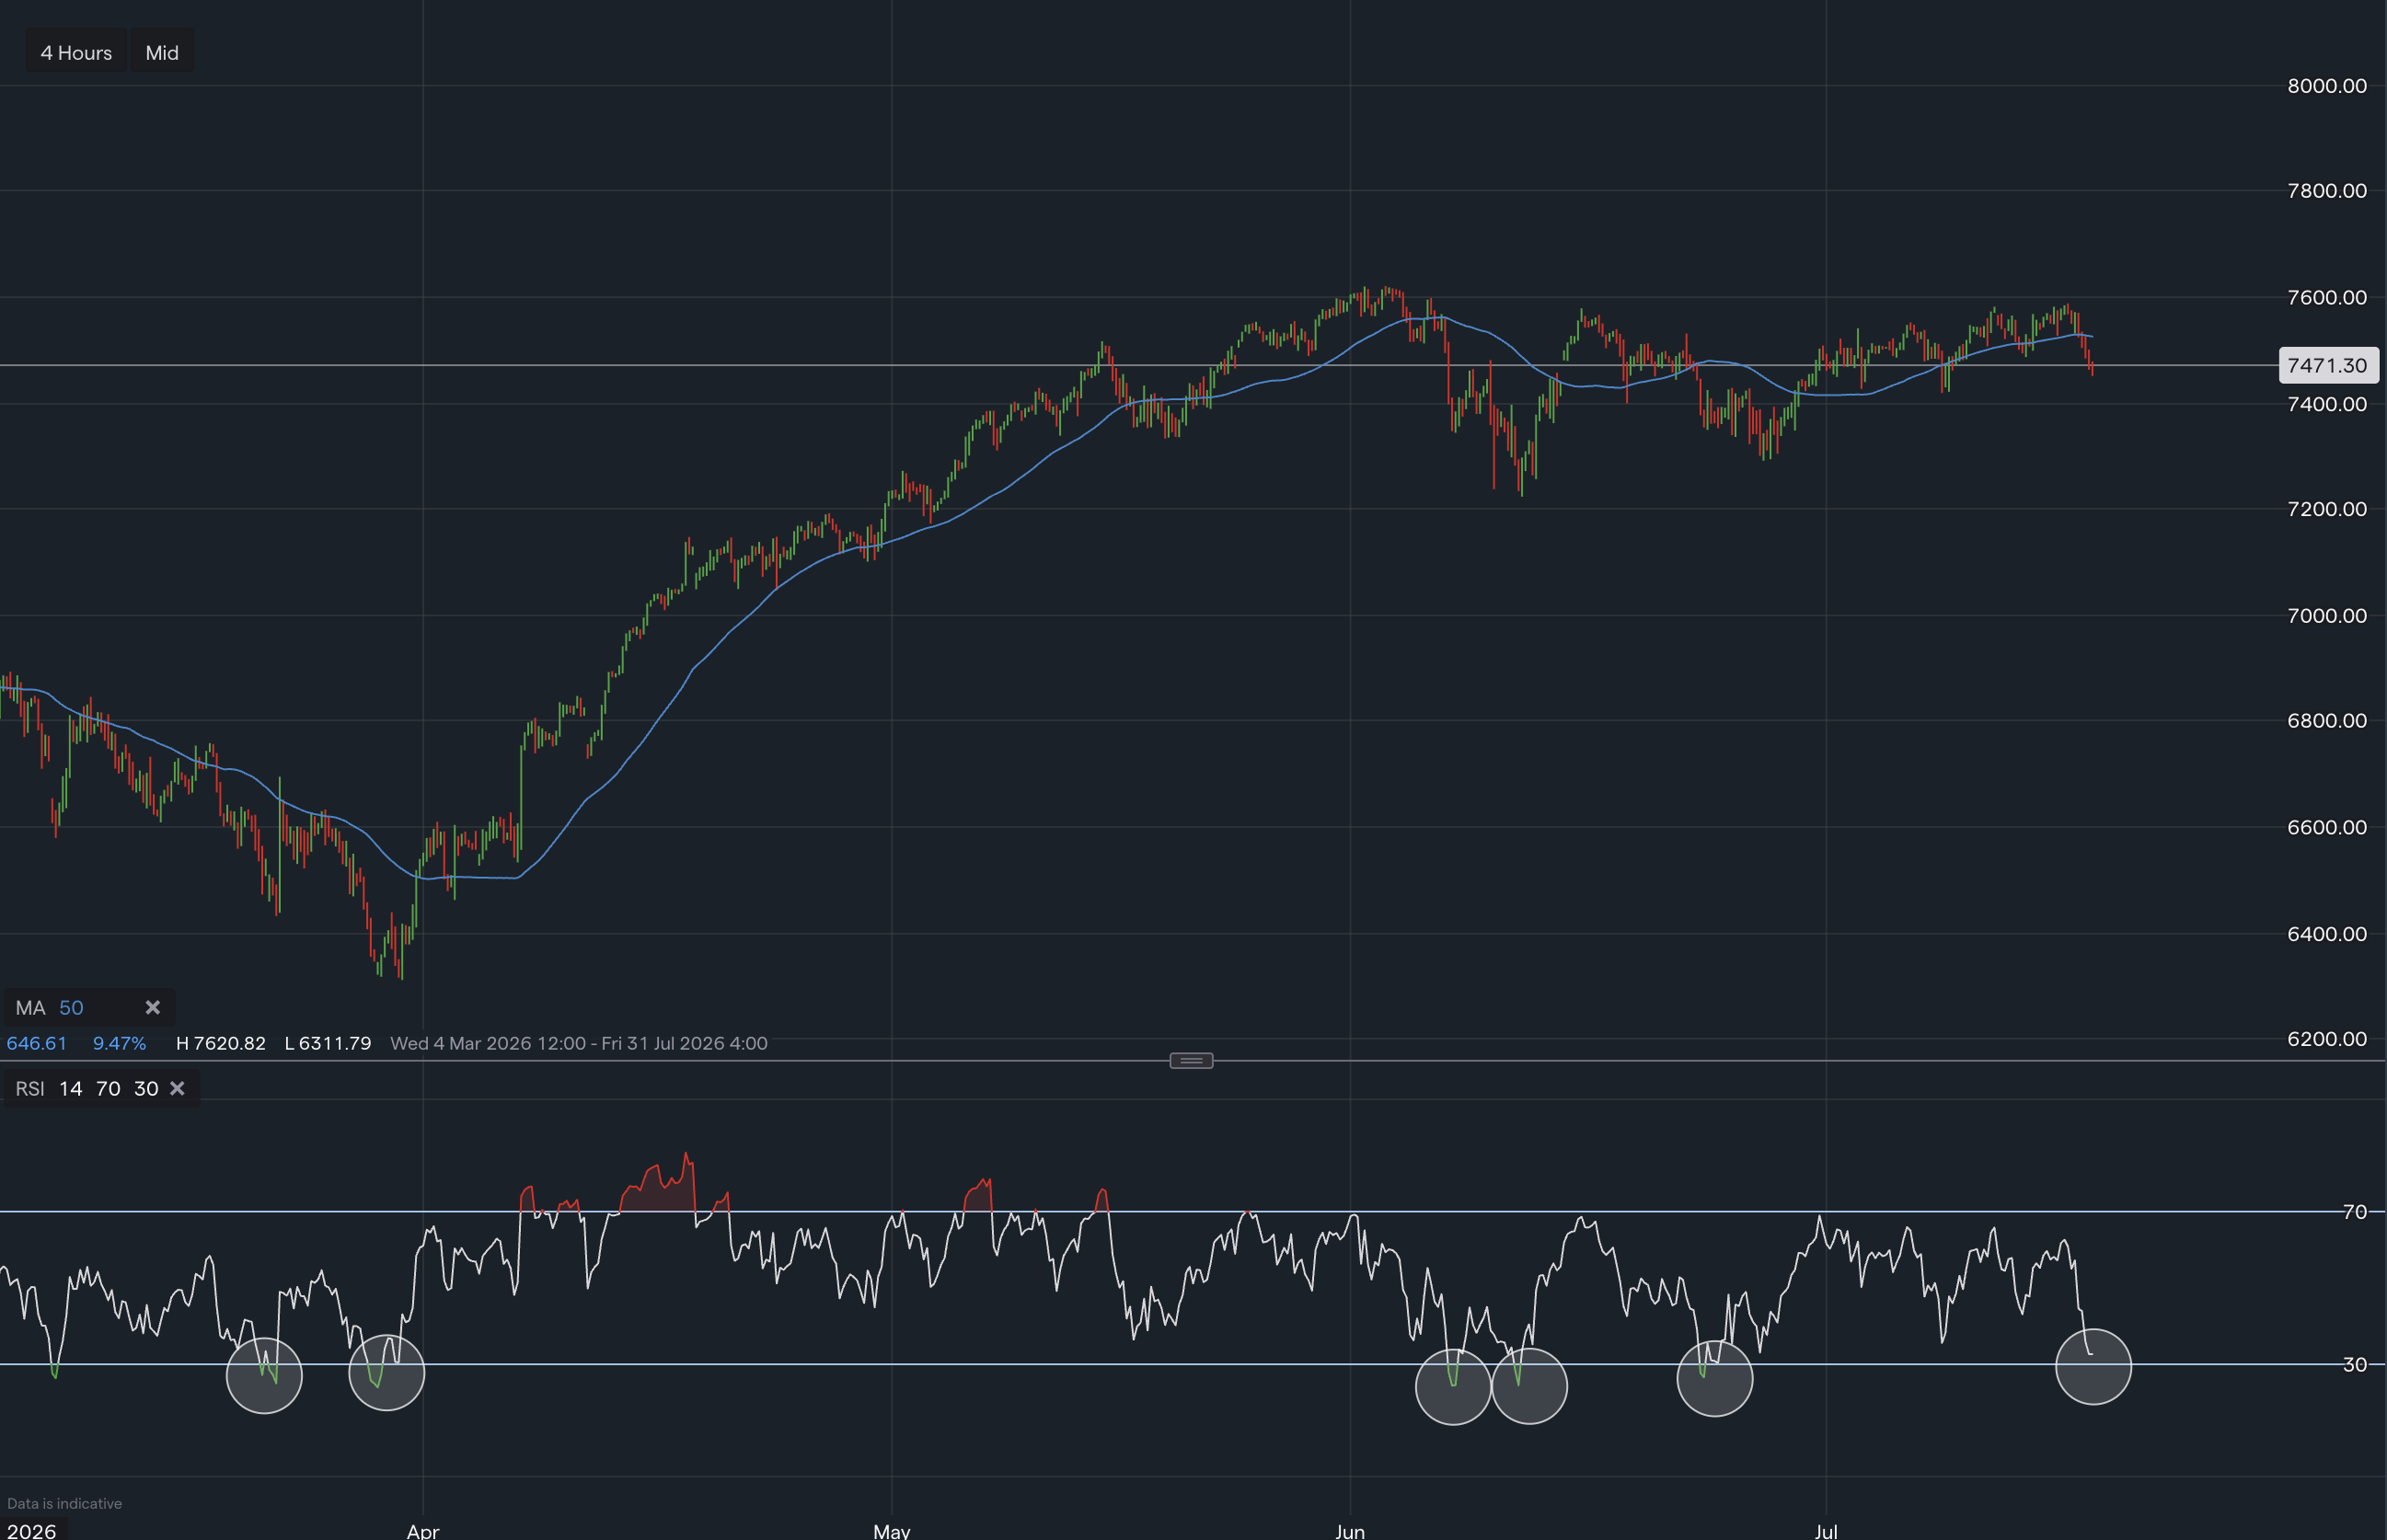
Chart Data By IG


The market has recently pulled back towards the 7,470 Area again, following several weeks of relatively sideways trading. Although the latest decline has weakened short-term momentum, the Relative Strength Index suggests the move may be creating a potential buying opportunity.
On the 4-hour chart, the RSI has fallen towards 30, a level commonly associated with oversold market conditions. This indicates that selling pressure may have become stretched, particularly when compared with previous occasions shown on the chart. Historically, several earlier tests of the 30 RSI level have been followed by short-term recoveries. This does not guarantee that prices will immediately reverse higher. Still, it suggests the market may be approaching an area where buyers could begin to return, providing an opportunity to start an averaging-down long position.
The first area of potential support sits between approximately 7,440 and 7,470. This zone has previously acted as both support and resistance, making it an important short-term level for traders to watch. Should this area hold, the market could attempt to recover towards its 50-period moving average. However, a clear break below support could expose lower levels.
The main areas to monitor include:
A sustained move below the 7,380 area would weaken the short-term bullish argument, while a break below approximately 7,300 could suggest a deeper correction is developing.
The 50-period moving average currently appears to sit around 7,520–7,540. This could provide the first potential target should prices rebound from support. From the current level, this would represent a relatively modest recovery of roughly 50 to 70 points. As the moving average may initially act as resistance, traders could look for signs that price is losing momentum as it approaches this area. A stronger recovery above the moving average could then bring the recent highs between approximately 7,560 and 7,600 back into focus.
The current setup may offer a potential short-term buying opportunity, supported by an RSI reading close to oversold conditions and price testing an established support zone. The initial target would be a return towards the 50-period moving average near 7,520–7,540. However, the bullish setup remains dependent on the market holding above nearby support.
If price breaks decisively below 7,440, traders may instead look towards 7,380–7,400 as the next area where buyers could emerge. Further oversold conditions could provide an opportunity to progressively average down until the market rebounds to the Moving average or high.
Technical analysis does not guarantee future performance. Minipip is not authorised or regulated by the Financial Conduct Authority and does not provide investment advice. This content is for educational and informational purposes only. Capital is at risk.

Tradable assets:
Min.Deposit:
Max Leverage:
FCA:

Rating:
 Earnings Calendar
  Economic Calendar
  VAT Calculator
  Tax Free Childcare Calculator
 Percentage Calculator
 Compound Interest Calculator
  Loan Overpayment Calculator
 Mortgage Calculator
 Credit Card Calculator
 Investing
  Economics
 Trading
  Technical Analysis
  Personal Finance
 Calculator