Microsoft (MSFT): AI Leadership Supports Long-Term Growth
$396.94
21 Jul 2026, 22:43
Neutral

Join Minipip Academy and access free courses in investing, trading, economics, and more.
Sign Up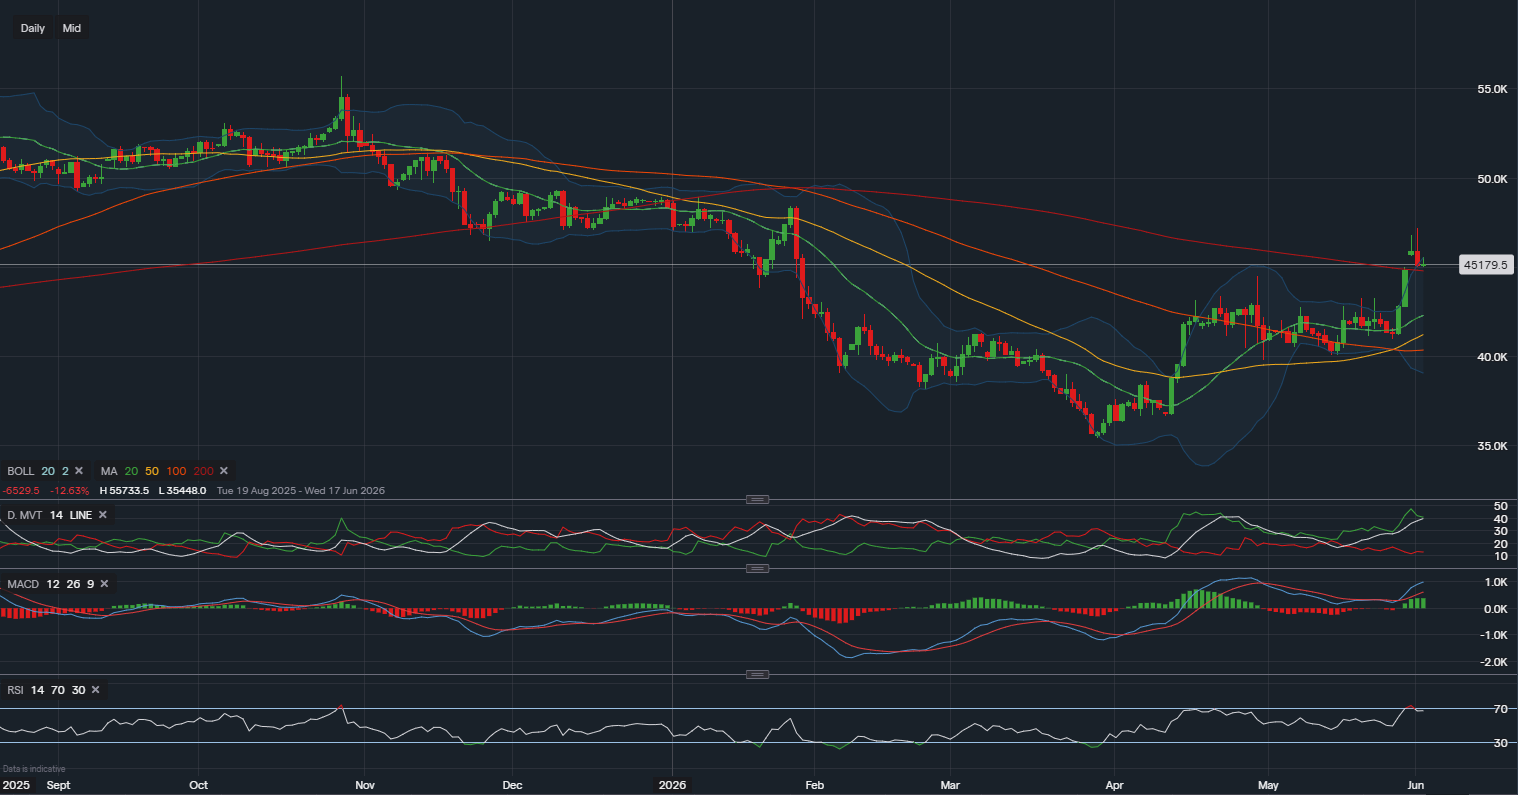
Microsoft Stock Analysis: Can Microsoft's Bullish Momentum Continue Through Mid-2026?
Microsoft stock has continued to display impressive strength in recent weeks, with buyers maintaining control of the broader trend. After successfully holding key support levels during previous market weakness, the stock has resumed its upward trajectory and is now testing a major technical barrier at its 200-day moving average.
While several momentum indicators remain strongly bullish, the stock is also showing signs of becoming overextended in the short term. Investors and traders are now assessing whether Microsoft's bullish momentum can overcome resistance or if a period of consolidation may be required before further gains.
Microsoft Technical Analysis
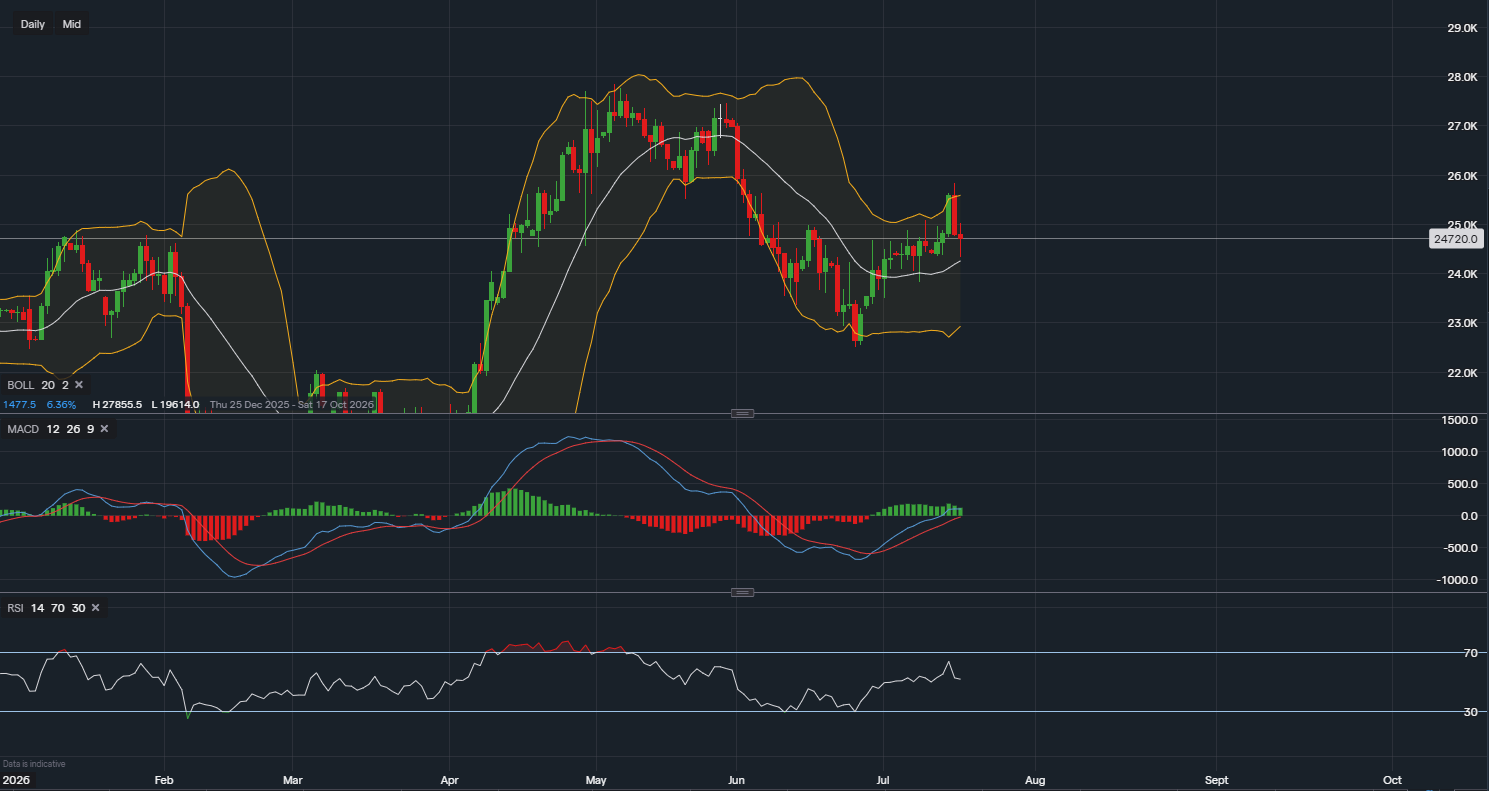
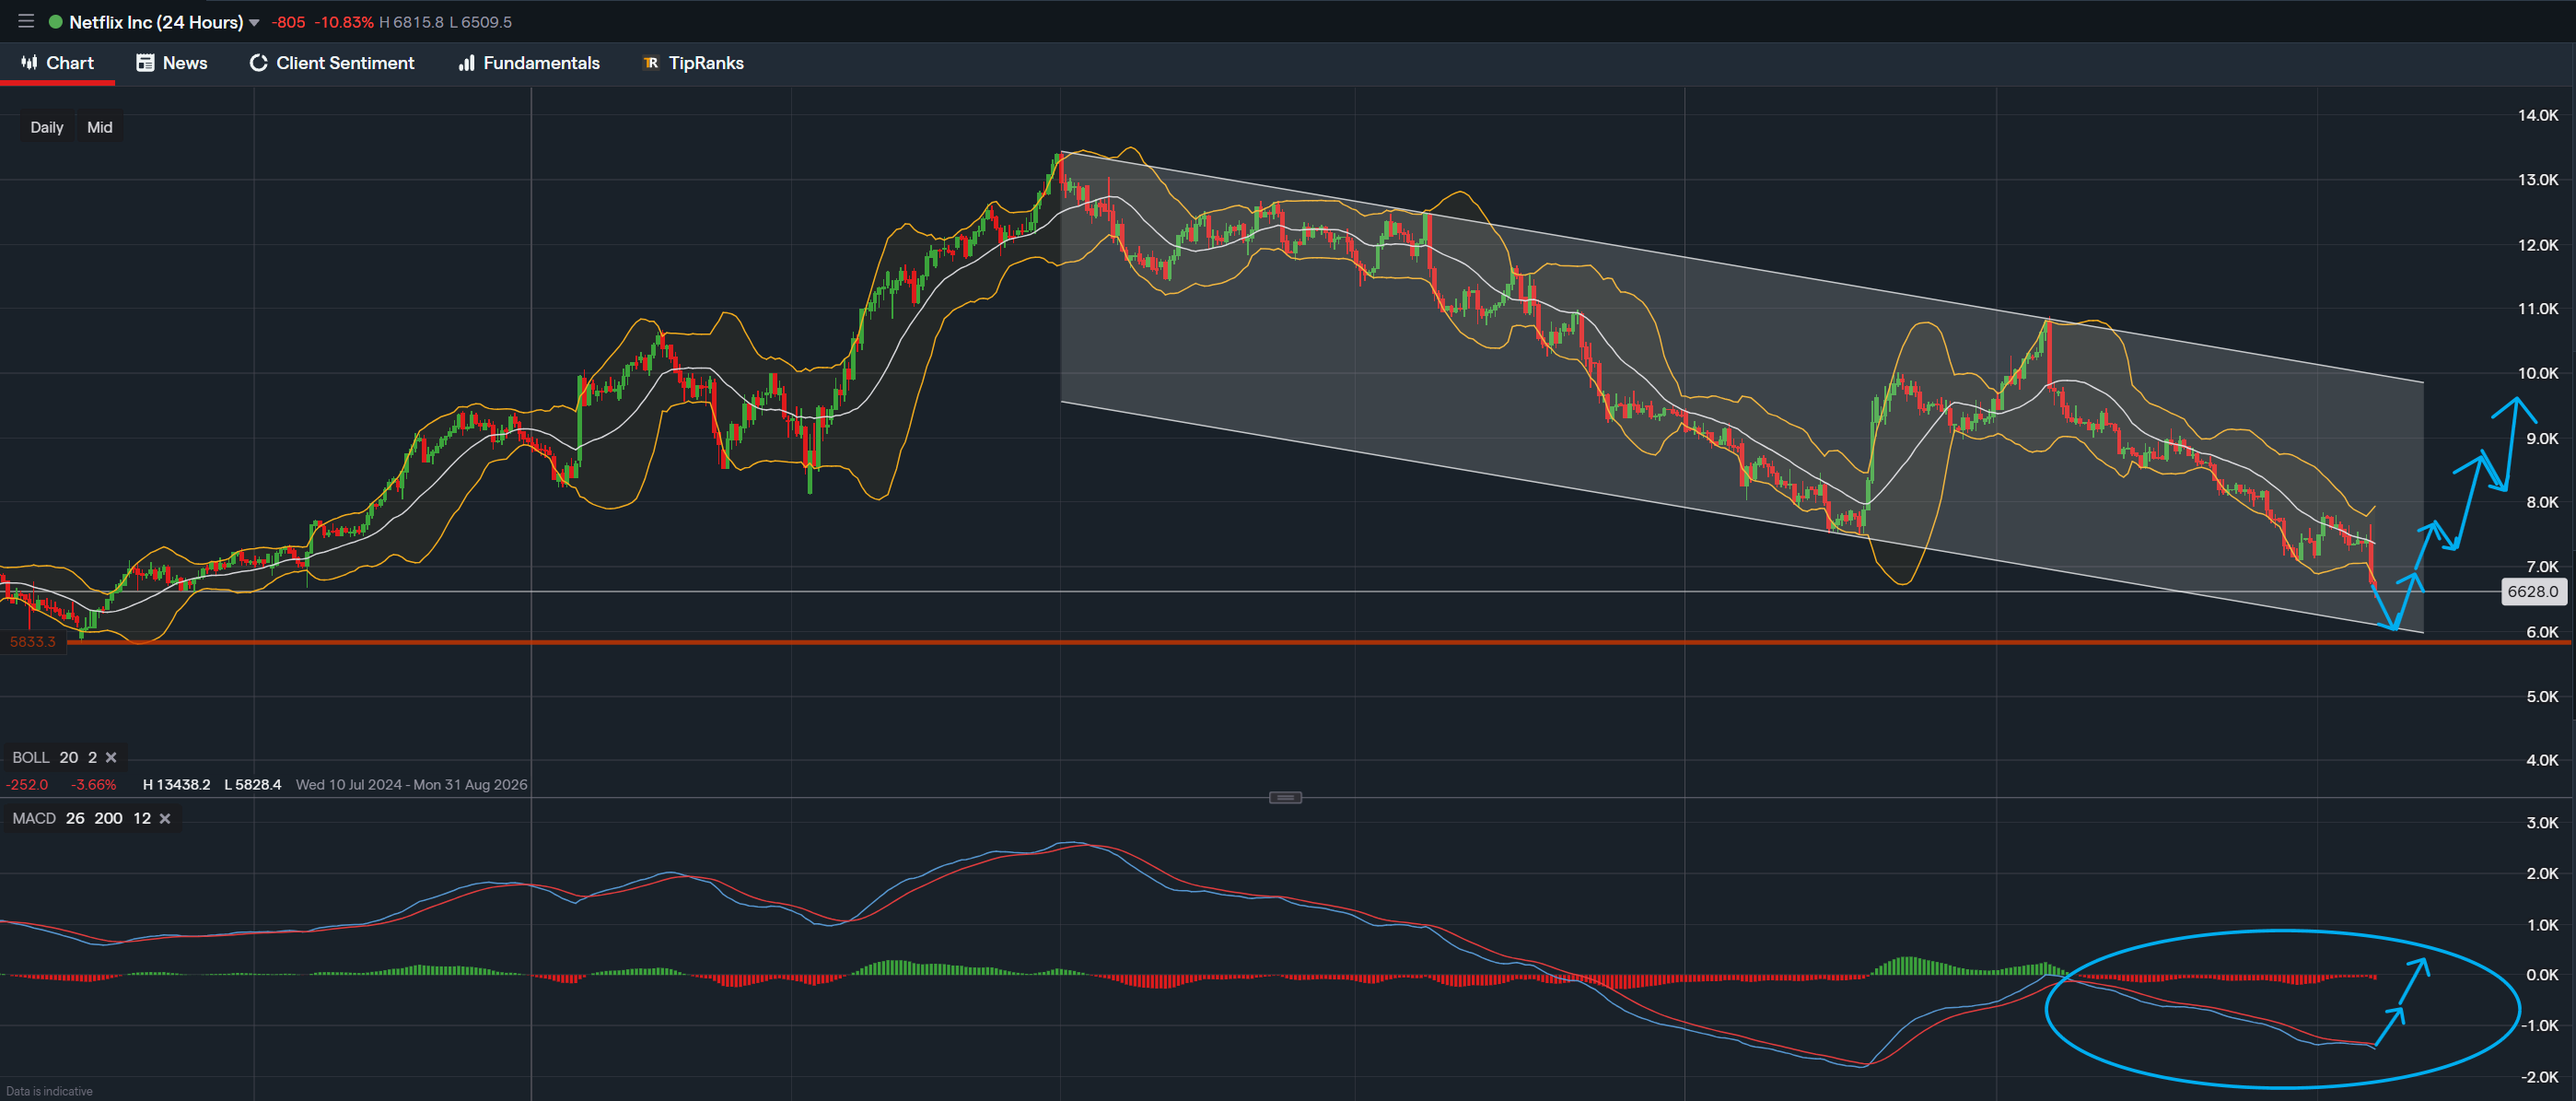
From a technical perspective, Microsoft continues to exhibit strong bullish characteristics. One of the most notable developments is the MACD indicator, which has recently generated bullish signals as the MACD line begins to strengthen above the signal line. This behaviour often suggests increasing buying momentum and can indicate the early stages of a sustained upward move.
Further supporting the bullish outlook is the Directional Movement Index (DMI), which remains firmly in favour of buyers. The positive directional indicator continues to dominate the negative indicator, highlighting the strength of the current trend and confirming that bullish momentum remains intact.
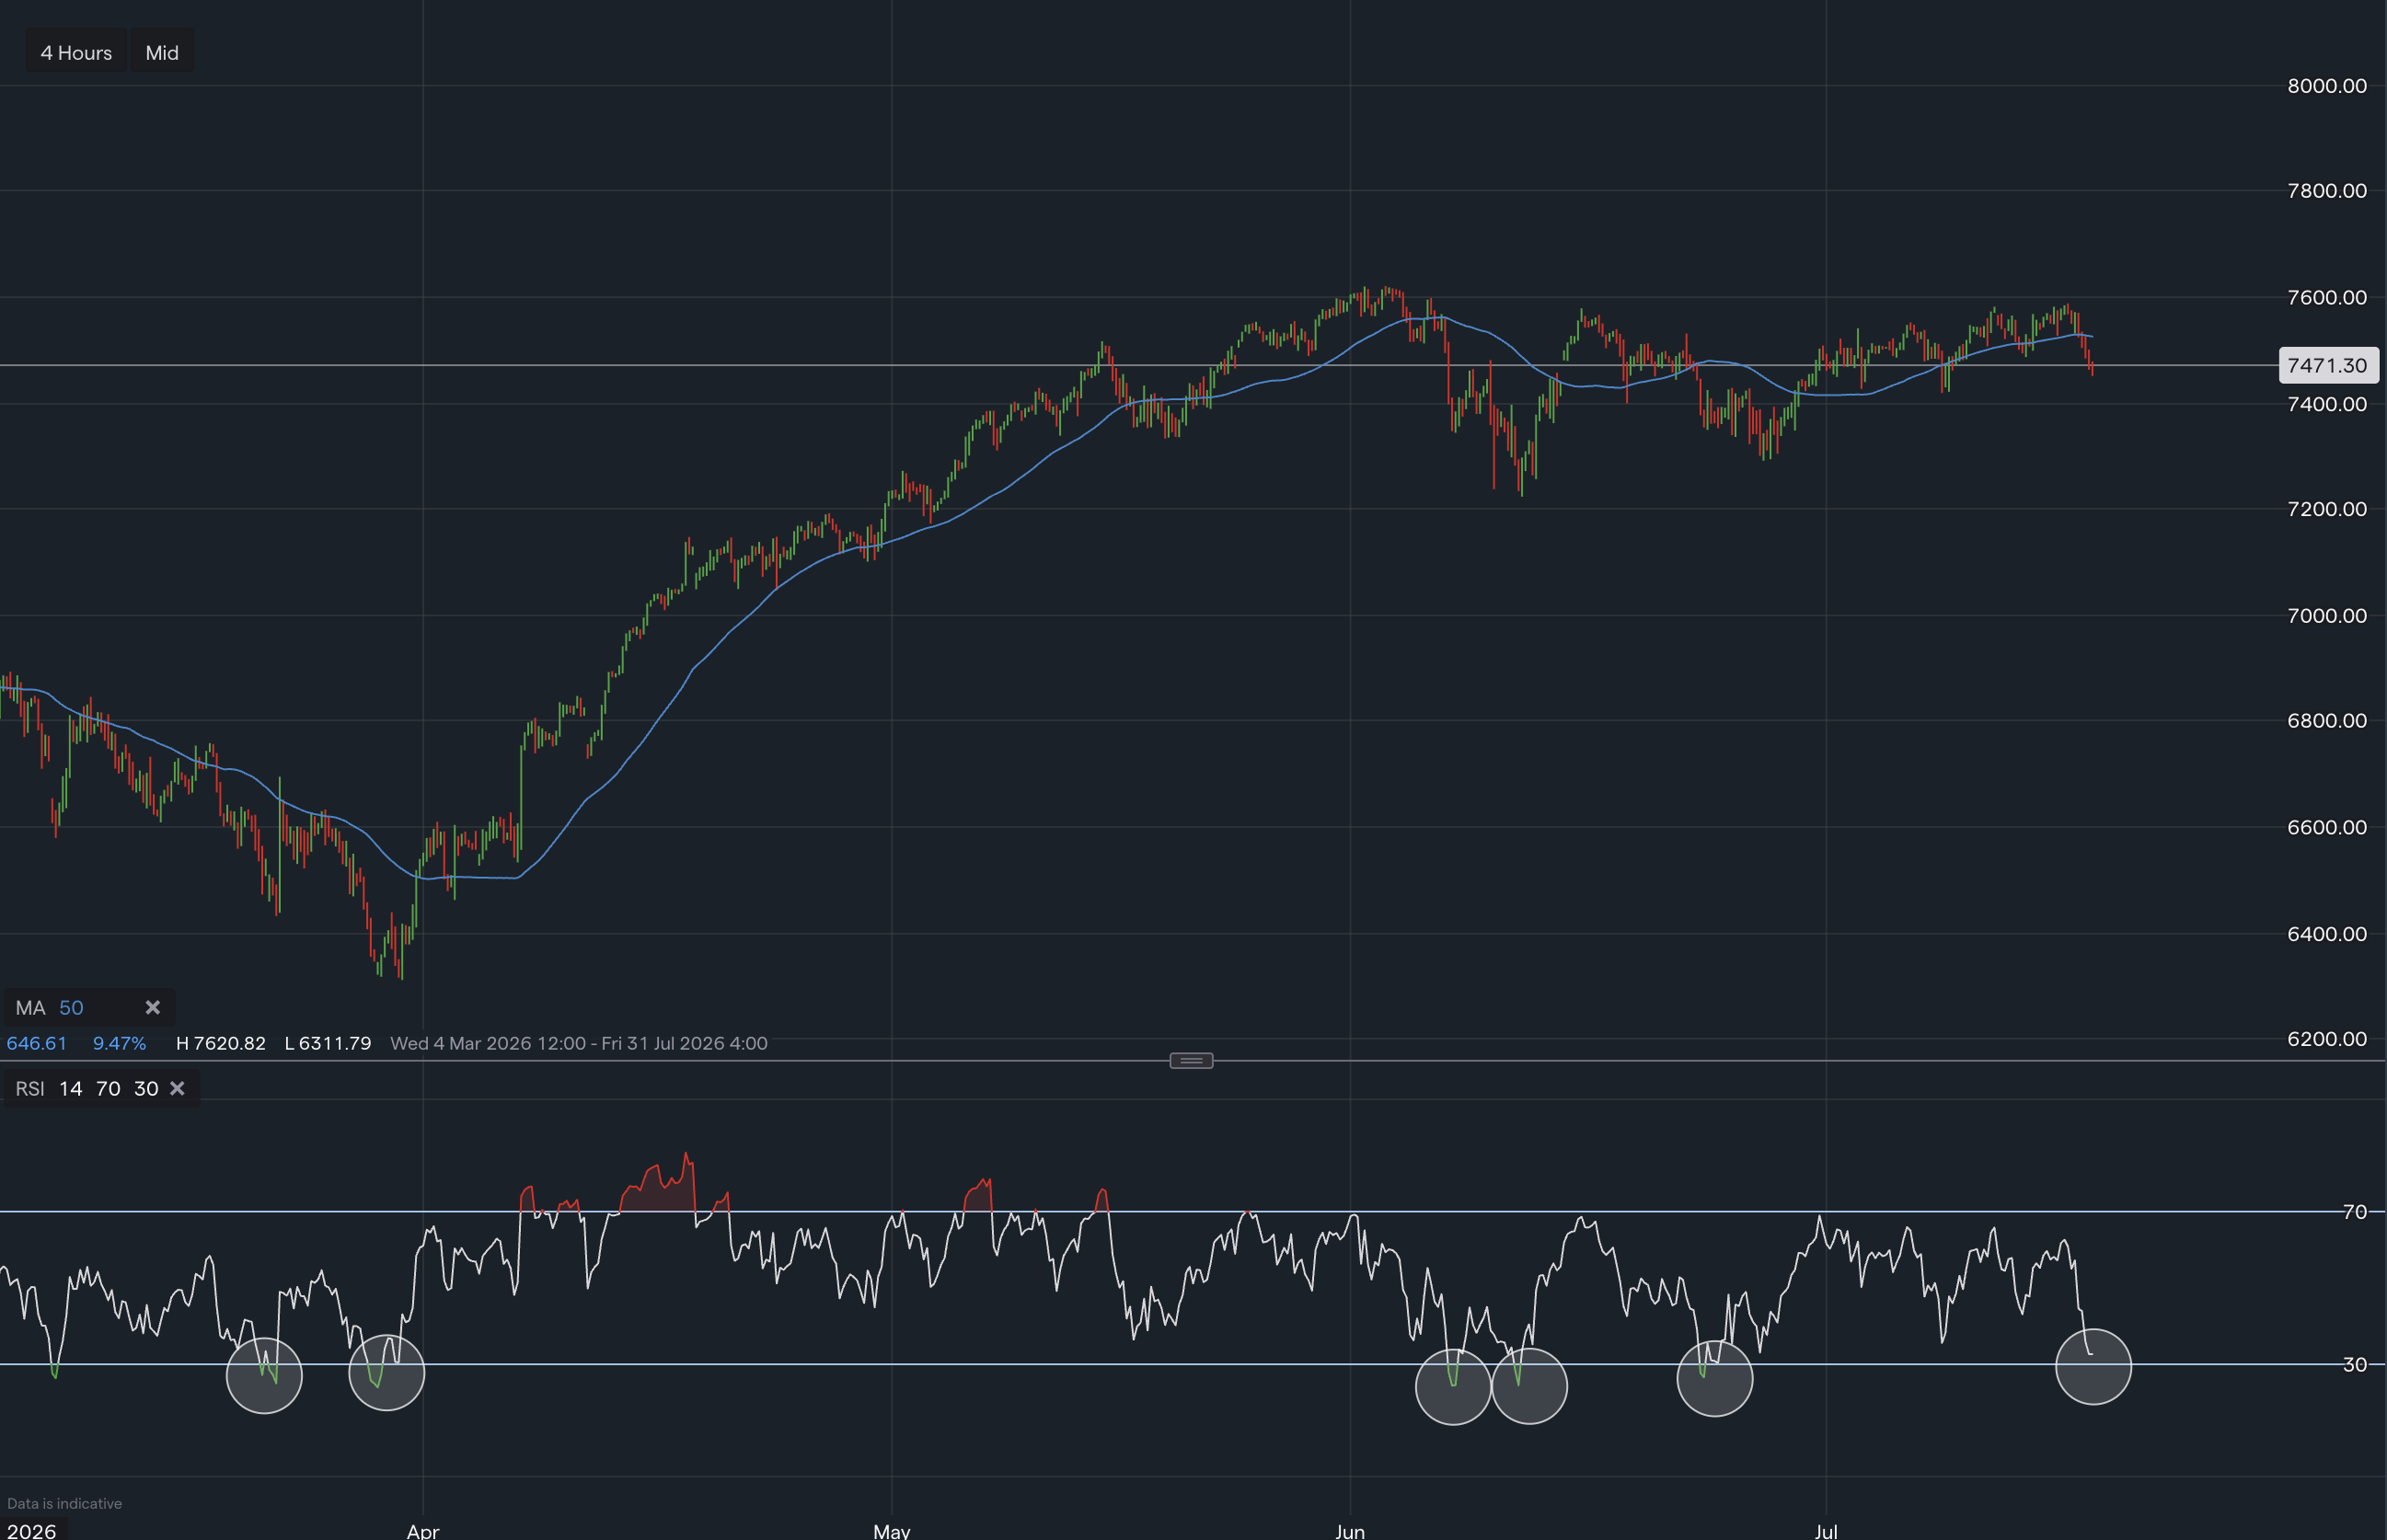
However, one potential cautionary signal comes from the Relative Strength Index (RSI), which has moved into overbought territory. While an elevated RSI does not necessarily signal an immediate reversal, it does suggest that the stock may be vulnerable to short-term profit-taking or periods of consolidation before extending higher. Additionally, this can be supported by a temporary price pullback from the upper Bollinger band.
The key technical level now remains the 200-day moving average. A decisive breakout above this resistance level could reinforce the bullish outlook and potentially attract additional buying interest from both institutional and retail investors.
Microsoft Fundamental Analysis
From a fundamental perspective, Microsoft continues to demonstrate strong financial health and attractive long-term growth prospects. The company currently trades at a price-to-earnings (P/E) ratio of 27.43, while its forward P/E ratio improves to 23.70, suggesting analysts expect earnings growth over the coming year.
Based on these valuation metrics, Microsoft's fair value range is estimated between $487.87 and $523.47, representing potential upside of approximately 7.87% to 15.74% from current levels. Further supporting the bullish outlook, Wall Street analysts maintain an average price target of $557.64, implying potential upside of 23.31%.
Microsoft's dominant position in cloud computing, artificial intelligence, enterprise software, and productivity solutions continues to provide a strong foundation for future revenue and earnings growth. As AI adoption accelerates and demand for cloud services remains robust, Microsoft appears well-positioned to benefit from several long-term technology trends.
Outlook for Traders and Investors
The overall outlook for Microsoft stock remains positive, supported by both strong fundamentals and favourable technical indicators. The combination of improving earnings expectations, bullish momentum signals, and continued leadership in key technology sectors suggests the potential for further upside in the months ahead.
However, investors should remain mindful of short-term risks. Technical indicators such as the Relative Strength Index (RSI) and Bollinger Bands indicate that the stock may be approaching overbought conditions, increasing the likelihood of temporary pullbacks or consolidation periods.
For traders, the 200-day moving average remains the key level to watch. A decisive breakout above this resistance zone could confirm the continuation of Microsoft's bullish trend, while failure to break higher may trigger short-term profit-taking. Investors considering new positions may benefit from monitoring price action around this critical level before making entry decisions.

Tradable assets:
Min.Deposit:
Max Leverage:
FCA:

Rating:
 Earnings Calendar
  Economic Calendar
  VAT Calculator
  Tax Free Childcare Calculator
 Percentage Calculator
 Compound Interest Calculator
  Loan Overpayment Calculator
 Mortgage Calculator
 Credit Card Calculator
 Investing
  Economics
 Trading
  Technical Analysis
  Personal Finance
 Calculator