Oracle Share Price Outlook: Could Oversold RSI Signal a Bullish Reversal?
$140.94
05 Jul 2026, 08:55
Bullish

Join Minipip Academy and access free courses in investing, trading, economics, and more.
Sign Up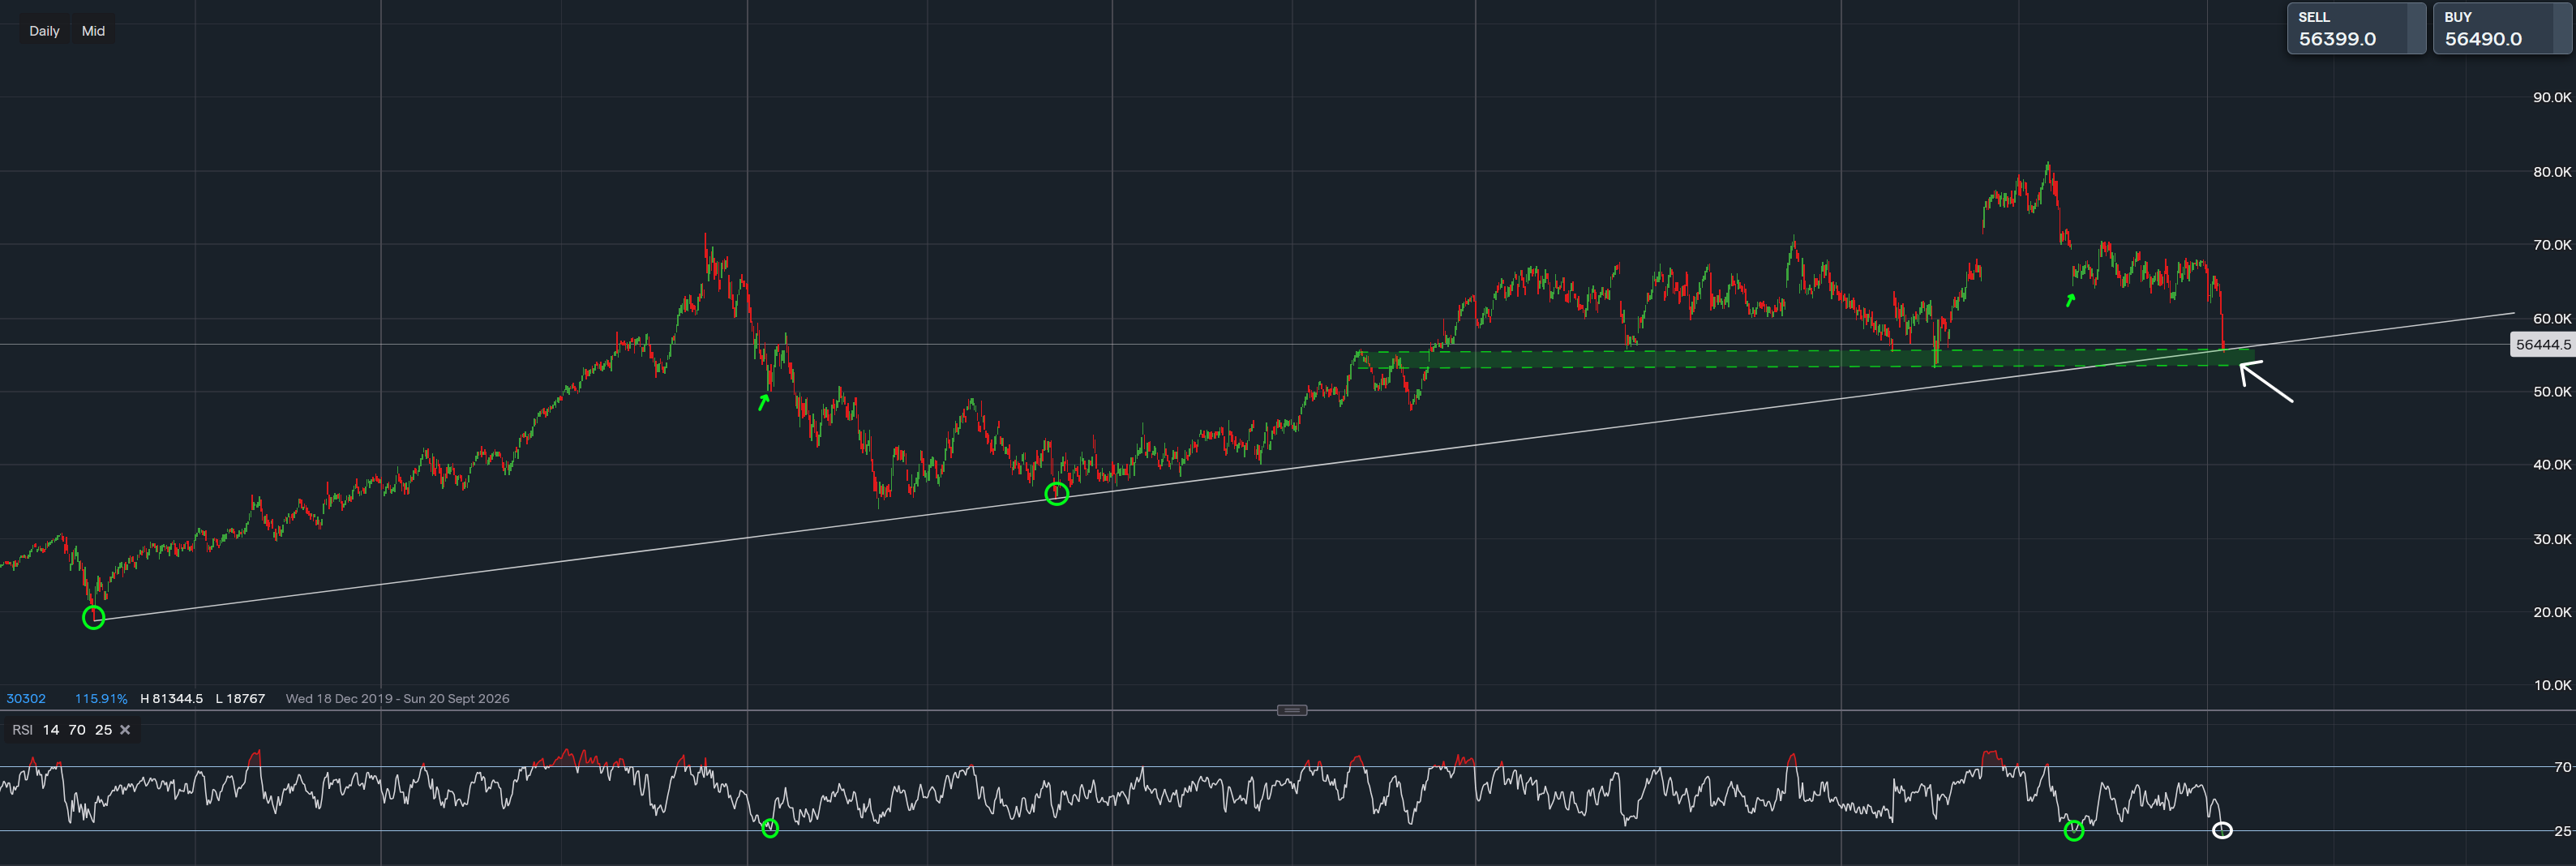
Chart & Data from IG
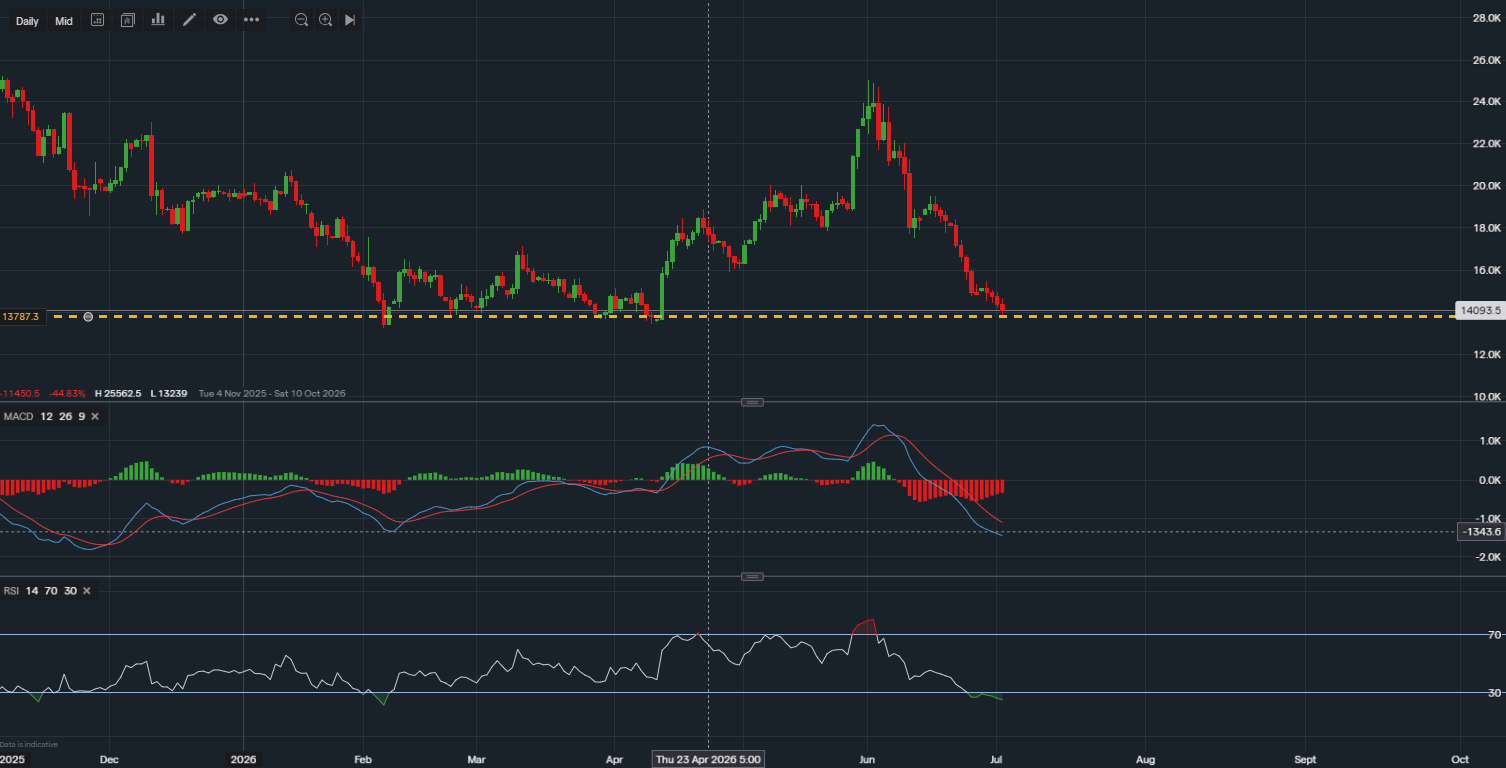
Intuit is currently showing oversold conditions on the daily chart, according to key technical indicators. Most notably, the Relative Strength Index (RSI) has dropped below 25, a level that has historically preceded strong short-term rebounds in the stock.
The last time Intuit’s RSI fell below 25 was on 25 August, after which the stock rallied approximately 8% over the following couple of weeks. A similar scenario occurred on 26 January 2022, when shares rebounded by nearly 15% within 10 trading days. These historical price movements suggest that Intuit may once again be approaching a short-term bottom.
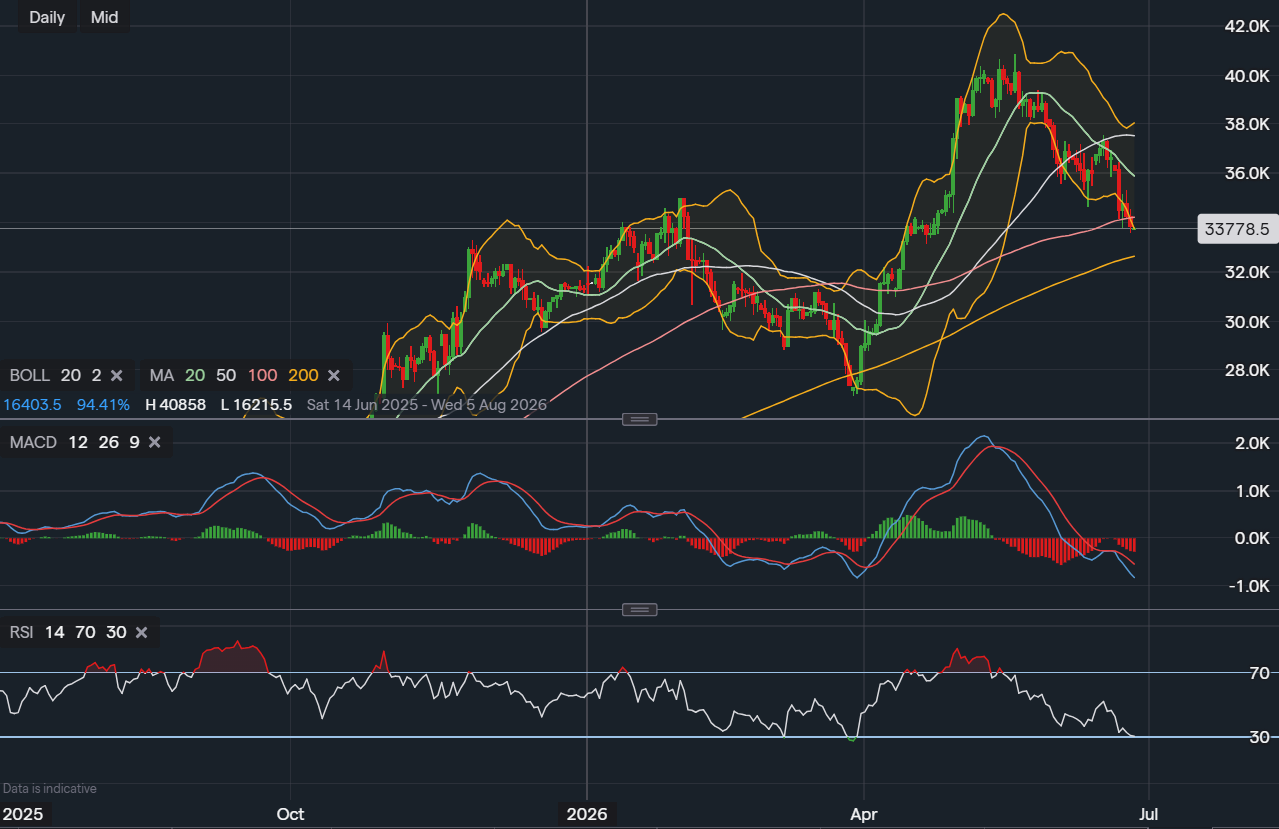
Further strengthening the bullish case is a long-term ascending trendline, dating back to the COVID-era lows. This trendline has acted as reliable support in the past, most recently around 3 November 2022, and price action has now returned to this level. Traders often view repeated tests of such a trendline as confirmation of a strong support zone, increasing the probability of a bounce.
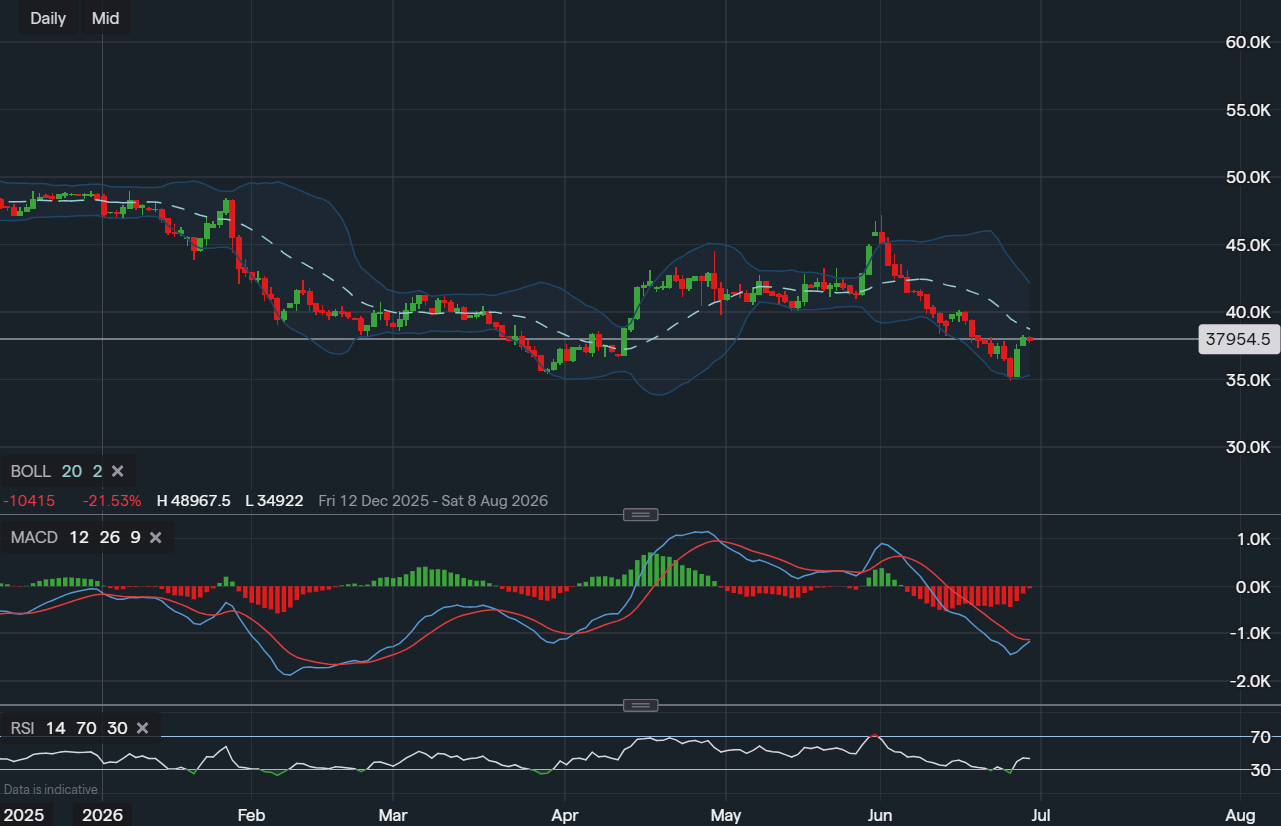
In addition to the trendline support, there is a well-established horizontal support zone between $532 and $557, which has held firm over the past couple of years. However, there is a small price gap between $534 and $540 that may still be filled if buyers struggle to maintain momentum around the current price of $564.44.
A potential gap fill into the $532–$557 region could actually attract additional buyers, provided the price begins to consolidate and show signs of stability. This area remains a critical zone for bulls to defend.
The bullish outlook would begin to weaken only if Intuit decisively breaks below April’s low at $532. A sustained move beneath this level would suggest further downside risk in the near term, invalidating the oversold bounce thesis.
Overall, Intuit’s current technical setup points to oversold conditions with multiple layers of support, increasing the likelihood of a short-term rebound. While a brief pullback to fill the lower gap remains possible, historical RSI behaviour and long-term support levels suggest that downside may be limited unless key support is broken.

Tradable assets:
Min.Deposit:
Max Leverage:
FCA:

Rating:
 Earnings Calendar
  Economic Calendar
  VAT Calculator
  Tax Free Childcare Calculator
 Percentage Calculator
 Compound Interest Calculator
  Loan Overpayment Calculator
 Mortgage Calculator
 Credit Card Calculator
 Investing
  Economics
 Trading
  Technical Analysis
  Personal Finance
 Calculator