News
Tesla and SpaceX Merger: What It Could Mean for Investors and Stock Prices
22 Oct 2026, 10:30


Join Minipip Academy and access free courses in investing, trading, economics, and more.
Sign Up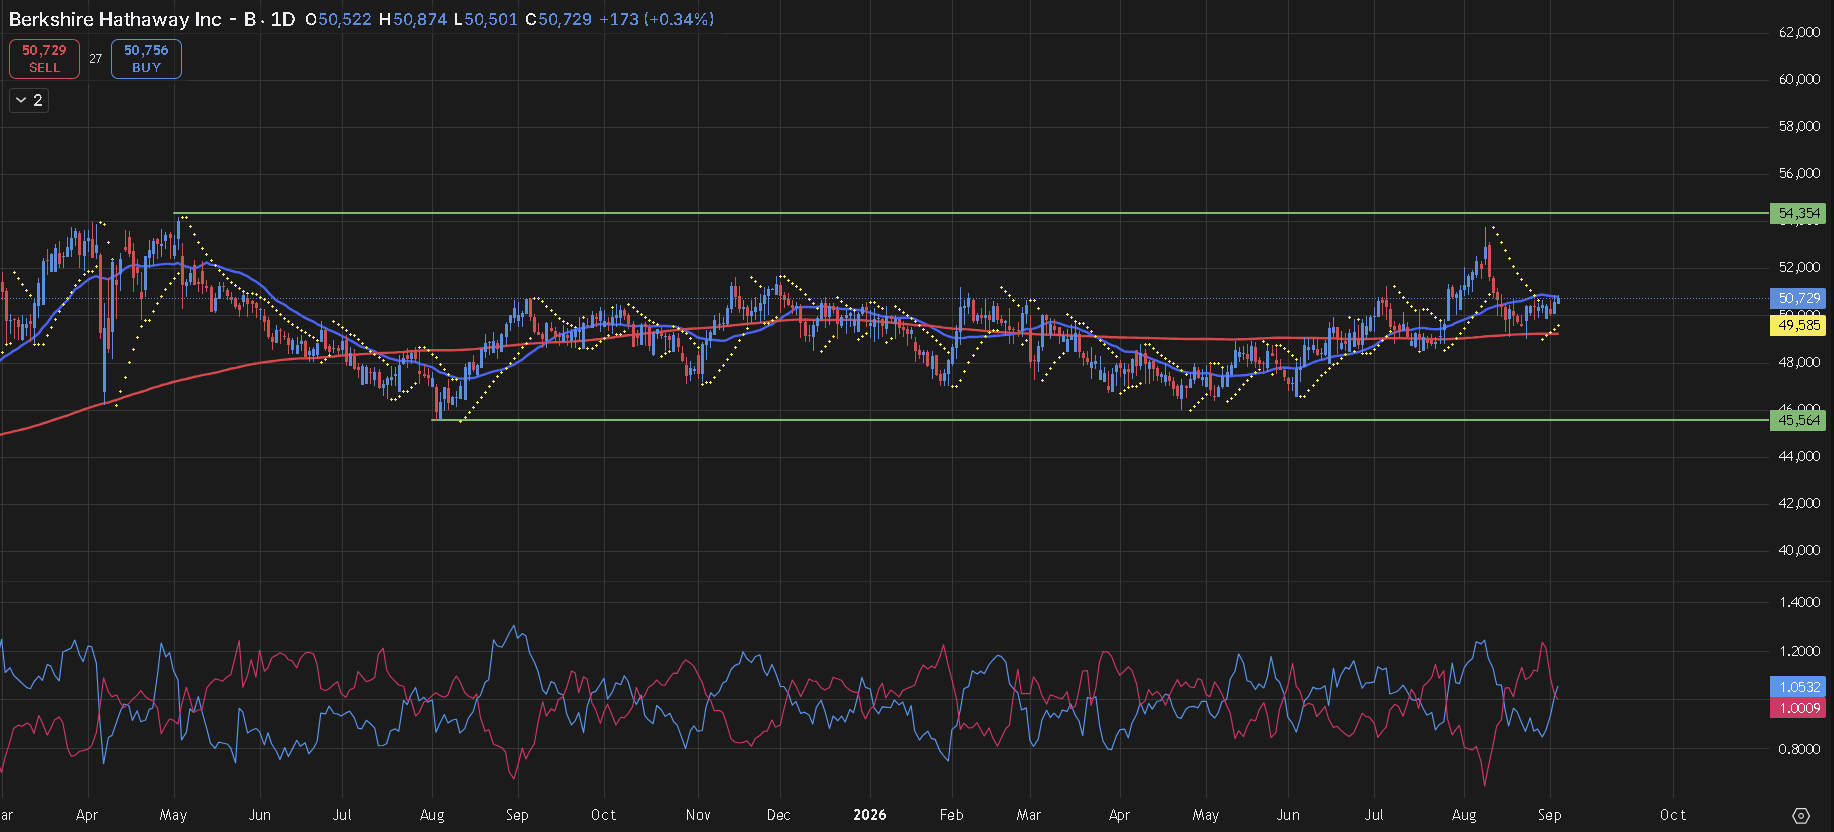
Data From Capital - Timeframe - Daily


Berkshire Hathaway Class B (BRK.B) is showing signs of renewed bullish momentum on the daily chart, with price currently trading around the $507 area. After spending an extended period consolidating within a broad trading range, the stock is once again approaching an area where a significant directional move could develop.
The current technical structure is being assessed using the Vortex Indicator (VI), Parabolic SAR and 24-period and 200-period Smooth Moving Averages, providing a combination of momentum, trend and price-direction signals.
Vortex Indicator Signals Improving Momentum
The Vortex Indicator is currently providing an interesting signal for Berkshire Hathaway. The VI+ line is positioned above the VI− line, with the latest readings shown on the chart at approximately 1.0532 and 1.0009 respectively.
This positioning suggests that bullish directional momentum currently has the advantage. Should the distance between the two lines continue to expand, it could provide additional confirmation that buyers are gaining strength and that the current upward movement has further room to develop.
The VI is particularly interesting at the present time because Berkshire is simultaneously holding above its longer-term moving average, creating a combination of positive momentum and a constructive underlying trend.
200-Period Moving Average Maintains the Bullish Bias
The 200-period Smooth Moving Average, currently positioned around $495.85, remains one of the most important technical references on the chart.
BRK.B is trading above this long-term average, meaning the broader price structure remains constructive. The 200-period moving average has also acted as an important trend filter, separating periods of longer-term strength from areas where momentum has weakened.
As long as Berkshire continues to hold above this level, the wider technical structure remains favourable to the upside.
24-Period Moving Average Tracks the Short-Term Momentum
While the 200-period average provides the broader trend perspective, the 24-period Smooth Moving Average offers a closer look at short-term price behaviour.
Price is currently trading around the 24-period average, highlighting an important battle between buyers and sellers. A sustained move above this shorter-term average could strengthen the case for another upward leg, particularly if it occurs alongside continued bullish VI momentum.
A widening separation between the 24-period and 200-period averages would also provide an additional indication that short-term momentum is beginning to align more strongly with the longer-term trend.
Parabolic SAR Remains Beneath Price
The Parabolic SAR is also supporting the current bullish structure. The latest SAR dots are positioned beneath the price candles, indicating that the indicator remains in an upward configuration.
This suggests that the recent price action continues to favour buyers. If the Parabolic SAR remains below price while the VI maintains its bullish positioning, the two indicators would continue to provide complementary confirmation of the prevailing momentum.
A reversal of the SAR dots above price would therefore become an important signal to monitor for any deterioration in the current trend.
BRK.B Remains Within a Major Trading Range
Despite the bullish signals developing across the indicators, Berkshire Hathaway remains within a much larger trading range.
The chart identifies a significant lower boundary around $455.64, while major resistance can be seen around $543.54. These two levels have created the framework within which BRK.B has been trading for an extended period.
With the current price sitting between these two extremes, the stock has not yet produced the decisive breakout required to establish a completely new longer-term price structure.
$543.54 Represents the Major Breakout Level
The $543.54 resistance area is arguably the most important level on the chart for the bulls.
A decisive move above this region could signal that Berkshire is finally breaking away from its established consolidation range. Such a move would become considerably more significant if accompanied by strengthening VI momentum, the Parabolic SAR remaining beneath price and the 24-period average moving firmly above the longer-term trend line.
A successful breakout could therefore transform the current range-bound structure into a potential continuation pattern, bringing higher price levels into focus.
Support Around $495.85 Could Define the Next Move
While the upside remains attractive from a technical perspective, the $495.85 region is equally important.
This level sits around the 200-period Smooth Moving Average and currently provides a key reference point for the broader bullish structure. Holding above this area would allow the existing trend to remain intact, while a sustained move below it would signal increasing weakness.
For the bulls, maintaining price above the 200-period average keeps the door open for another attempt at the upper boundary of the range.
Lower Timeframes Could Offer Earlier Opportunities
The daily chart provides the broader picture, but lower timeframes could offer traders earlier indications of how the next major move may develop.
Within the current range, shorter-term price action could create opportunities as BRK.B moves between established support and resistance areas. Traders monitoring the lower timeframes may therefore look for changes in VI momentum, interactions with the 24-period moving average and Parabolic SAR reversals to identify potential shifts in short-term direction.
The distinction between a range trade and a breakout trade remains important. A move towards $543.54 represents an approach to resistance, whereas a sustained move beyond that level would represent a much more significant technical development.
Momentum Is Beginning to Align
What makes the current setup particularly interesting is the alignment between the different technical indicators.
The VI+ remains above VI−, the Parabolic SAR is beneath price, and BRK.B continues to trade above the 200-period Smooth Moving Average. Meanwhile, the 24-period average is positioned close to the current price, making it an important short-term momentum reference.
When multiple indicators begin pointing in the same direction, the technical picture can become more compelling. However, the market still needs to prove that momentum can translate into a sustained move beyond the established resistance.
The Bigger Picture Remains Constructive
From a wider technical perspective, Berkshire Hathaway continues to demonstrate resilience. Despite repeated periods of consolidation, the stock has maintained its position above the long-term moving-average structure and has recently attempted to regain upside momentum.
The current position therefore places BRK.B at an interesting stage of its broader market cycle. Buyers have an opportunity to push price towards the upper end of the range, while sellers will be looking to defend the established resistance zone.
The reaction around these key levels could ultimately determine the next significant directional move.
BRK.B Technical Outlook
Overall, Berkshire Hathaway Class B is presenting a cautiously bullish technical setup. The Vortex Indicator currently favours positive directional momentum, the Parabolic SAR remains beneath price and the stock is trading above its 200-period Smooth Moving Average.
The immediate focus remains on whether price can maintain momentum above the $495.85 area and build enough strength to challenge the major $543.54 resistance level.
A convincing breakout above $543.54 would represent the strongest bullish development visible on the current chart and could signal that Berkshire Hathaway is moving beyond its prolonged consolidation phase. Until then, the stock remains within its broader trading range, leaving both momentum traders and range traders with important levels to monitor.
For now, the technical structure continues to lean towards the upside, with the Vortex Indicator providing the momentum signal, the Parabolic SAR confirming the current directional bias and the 200-period Smooth Moving Average acting as the longer-term trend filter.
Disclaimer:
This analysis is provided for informational and educational purposes only and should not be interpreted as financial advice.

Tradable assets:
Min.Deposit:
Max Leverage:
FCA:

Rating:
 Earnings Calendar
  Economic Calendar
  VAT Calculator
  Tax Free Childcare Calculator
 Percentage Calculator
 Compound Interest Calculator
  Loan Overpayment Calculator
 Mortgage Calculator
 Credit Card Calculator
 Investing
  Economics
 Trading
  Technical Analysis
  Personal Finance
 Calculator