News
Tesla and SpaceX Merger: What It Could Mean for Investors and Stock Prices
22 Oct 2026, 10:30


Join Minipip Academy and access free courses in investing, trading, economics, and more.
Sign Up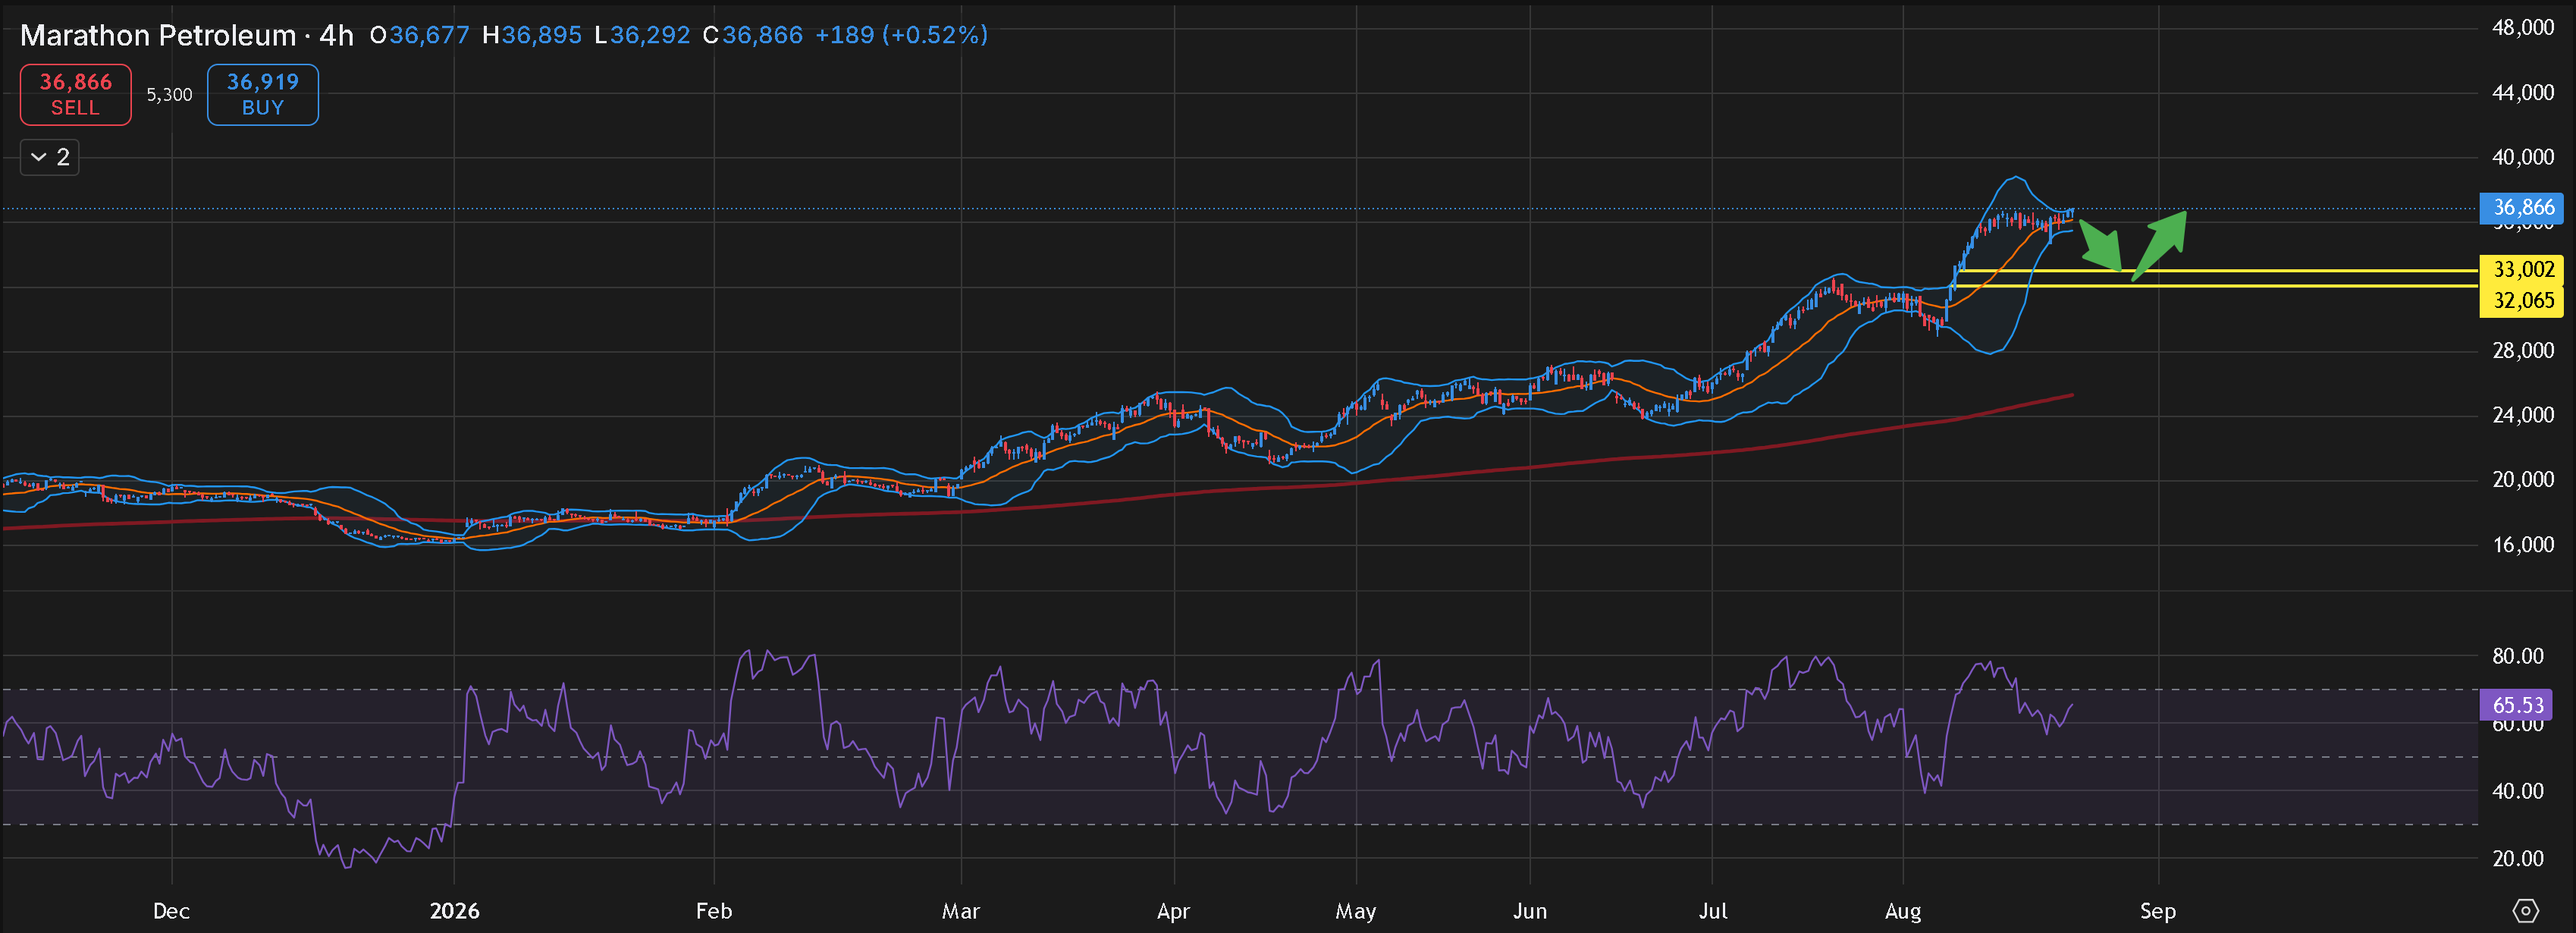
Capital Data- Timeframe - 4H


Marathon Petroleum (MPC) continues to display a strong bullish structure on the 4-hour chart. Price has advanced considerably over recent months, moving from the lower levels shown on the chart towards the current 36,866 area, while remaining comfortably above the smooth moving average.
The overall structure continues to favour the upside, with price maintaining a series of higher highs and higher lows. This means that the current weakness can potentially be viewed as a technical pullback rather than an immediate indication that the broader bullish trend has ended.
A Technical Pullback Could Be Developing
The most important feature on the current chart is the potential retracement from the recent high. After a strong upward move, MPC is now consolidating beneath its recent peak, creating the possibility of a pullback towards the highlighted 32,065–33,002 yellow zone.
This area represents the potential Fair Value Gap (FVG) highlighted on the chart. If price retraces into this region and buying interest returns, it could provide a potential area for the bullish trend to regain momentum.
The green arrows illustrate this possible scenario, with price potentially moving lower into the yellow zone before finding support and continuing towards the upside.
RSI Shows Momentum Cooling
The Relative Strength Index (RSI) is currently around 65.53, keeping the indicator above the important 50 level. This suggests that bullish momentum remains present, despite the recent consolidation.
However, RSI has already moved through elevated levels during the recent rally, meaning some additional cooling could be healthy for the market. A deeper RSI retracement towards the 50 area or potentially 40 to 50 region could coincide with price moving into the FVG.
Importantly, RSI does not necessarily need to reach 30 for the retracement to be considered complete. A move towards 30 would represent a much deeper pullback into oversold territory. The more important factor is whether RSI begins to stabilise and turn higher as price approaches the yellow support zone.
Bollinger Bands Signal a Potential Volatility Expansion
The Bollinger Bands are also providing an important indication. Following the significant upward movement, the upper and lower bands have begun tightening around price.
This narrowing suggests that volatility is contracting and that MPC could be approaching a period of expansion. Bollinger Band compression does not determine whether the next move will be bullish or bearish, but it does suggest that a stronger price movement could develop once the current consolidation is resolved.
For MPC, the key question is whether that volatility expansion occurs following a retracement into the yellow FVG or whether price breaks higher directly from the current consolidation.
The Smooth Moving Average Supports the Trend
The smooth moving average remains positioned beneath price and continues to slope higher, providing further confirmation that the broader trend remains bullish.
The distance between the current price and the moving average also highlights the strength of the preceding rally. Because of this, a retracement towards the 32,065–33,002 area would not necessarily invalidate the bullish structure.
Instead, the way price reacts around this region could provide important information about whether buyers are prepared to defend the existing trend.
The $32,065–$33,002 Zone Is the Key Area
The yellow zone between 32,065 and 33,002 is arguably the most important technical area on the current MPC chart.
A controlled retracement into this region would allow price to potentially fill the highlighted Fair Value Gap while simultaneously giving RSI an opportunity to cool down and volatility to reset.
If price reaches the zone and begins showing signs of renewed buying pressure, particularly alongside RSI turning higher, this could strengthen the technical case for a bullish continuation.
However, a decisive breakdown through the entire zone would weaken this particular bullish setup and could indicate that MPC is entering a deeper correction.
Recent Highs Remain the Major Resistance
If MPC successfully finds support within the yellow zone, attention would likely return towards the recent highs around the 38,000–39,000 area shown on the chart.
A successful move through the previous high would strengthen the bullish structure and potentially place MPC into a new phase of price discovery. Traders would still need to monitor momentum and volatility at that point rather than assuming that a breakout will automatically continue higher.
TipRanks Analyst Sentiment Remains Positive
According to TipRanks, MPC currently carries a Moderate Buy consensus based on 15 analysts, with the majority favouring a Buy rating. This provides a supportive backdrop alongside the bullish technical structure currently visible on the chart.
The current setup does not necessarily suggest that the bullish trend is coming to an end. Instead, the chart appears to be showing the possibility of a short-term consolidation or retracement following a substantial upward move.
The combination of price remaining above the smooth moving average, RSI holding above 50 and the Bollinger Bands tightening suggests that MPC remains technically constructive, while also leaving room for a deeper pullback before the next major move.
The 32,065–33,002 yellow FVG zone therefore becomes the area to watch closely. A retracement into this region followed by renewed buying pressure could create a potentially attractive technical continuation setup.
MPC Technical Outlook
Overall, the Marathon Petroleum (MPC) technical outlook remains bullish, but the chart suggests that patience could be important.
Rather than chasing price after its recent advance, waiting to see whether MPC retraces into the 32,065–33,002 zone could provide greater confirmation of the market's next move. If buyers defend the area and momentum begins to turn higher, the previous highs could once again become the focus.
The alternative scenario is that MPC continues higher without completing the anticipated retracement. In that case, traders would need to assess whether the breakout is supported by sufficient momentum rather than assuming that price must return to the FVG.
Ultimately, the trend remains your friend, but confirmation is key. The current chart presents a potential bullish continuation scenario, while the yellow zone provides an important technical reference for determining whether the pullback is simply a healthy retracement or the beginning of a deeper correction.
Disclaimer:
This analysis is provided for informational and educational purposes only and should not be interpreted as financial advice

Tradable assets:
Min.Deposit:
Max Leverage:
FCA:

Rating:
 Earnings Calendar
  Economic Calendar
  VAT Calculator
  Tax Free Childcare Calculator
 Percentage Calculator
 Compound Interest Calculator
  Loan Overpayment Calculator
 Mortgage Calculator
 Credit Card Calculator
 Investing
  Economics
 Trading
  Technical Analysis
  Personal Finance
 Calculator