News
Tesla and SpaceX Merger: What It Could Mean for Investors and Stock Prices
22 Oct 2026, 10:30


Join Minipip Academy and access free courses in investing, trading, economics, and more.
Sign Up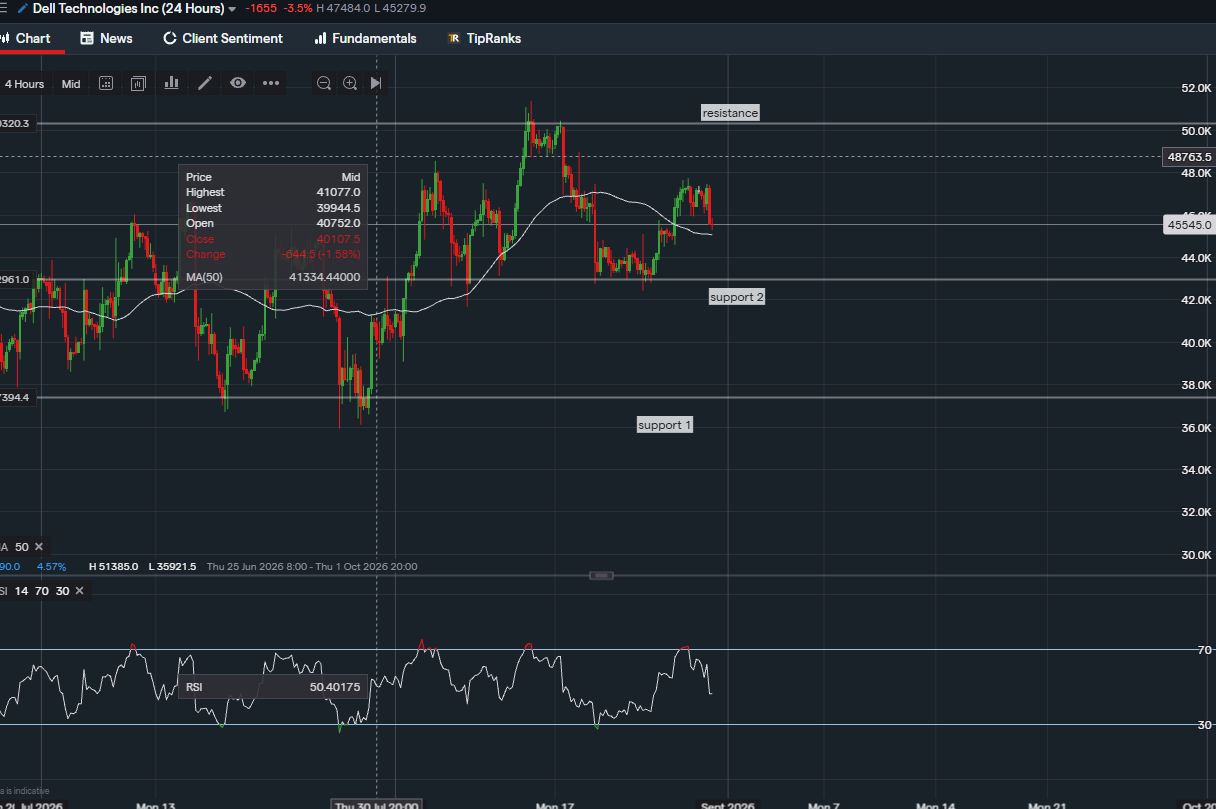
Dell Earnings Preview: Can DELL Extend Its AI-Driven Rally?


Dell Technologies is currently trading within a broader uptrend structure, having established a clear sequence of higher lows following its move off the summer swing low. Price rallied strongly from the low-$300s area into the low-$500s, before the recent pullback brought the stock back towards the middle of that range.
The current retracement has pulled price back towards the $415-$420 support zone — an important technical area, because a successful reaction from this level would allow Dell to rotate back towards the middle and upper sections of its recent range. As long as price continues to respect this support and maintains its higher-low structure, the broader bullish trend remains technically intact. Today's session, down roughly 3.5% to around $455, sits comfortably within that range rather than threatening the structure outright.
Momentum Indicators Show a Mixed but Constructive Picture
Momentum readings are giving a mixed, but broadly constructive, signal. RSI(14) has cooled from an overbought reading near 70 last reached in the run-up to the recent high - back to a neutral 50-53. That is a healthy reset rather than a warning sign on its own: it shows the recent rally lost some steam without slipping into oversold, distressed territory.
The Current Range Is the Key Decision Zone
Price has effectively been ranging between the $415-$420 support shelf and the $500-$510 resistance zone since the rally paused. That range is the important battleground on the chart right now: a clean hold of support keeps the higher-low sequence intact, while a decisive move back through resistance would be the strongest signal that the broader uptrend is resuming.
This kind of boundary-to-boundary behaviour echoes the stock's own price history earlier in the summer, when it spent time consolidating between a lower and upper range before eventually breaking into the current uptrend. The present range looks similar in character, only now playing out at a much higher price level and with the broader trend pointing upward rather than sideways.
TipRanks Analyst Outlook Supports the Longer-Term Picture
The technical structure can also be viewed alongside the current TipRanks analyst outlook. Coverage over the past three months shows a Strong Buy consensus, made up of 10 Buy ratings against 3 Hold ratings and no Sell ratings. The average 12-month price target sits at $529.18, roughly 17% above the current price, with individual targets ranging from $434 on the low end to $700 on the high end.
This forecast does not determine the technical direction of the stock, but it provides useful longer-term context. The analyst outlook is broadly constructive, while the technical chart is currently showing a bullish structure undergoing a short-term consolidation. The important distinction is that the analyst forecast represents an expectation rather than a confirmed future price - the technical structure will ultimately need to validate any continuation towards higher levels.
Technical Levels to Monitor
From a technical perspective, the $415-$420 support zone remains the most important area on the chart. Holding this region would maintain the current higher-low structure.
The $500-$510 area is the next zone to watch on the upside - a sustained break above this resistance would represent a meaningful continuation signal.
Below support, the deeper $370-$380 zone is the next relevant floor, only likely to come into play if the current pullback extends well beyond the $415-$420 shelf.
A decisive break below the $415-$420 zone would weaken the current bullish structure and require the trend to be reassessed. Dell's next earnings report, due 1 September 2026, is also worth flagging as a near-term catalyst that could accelerate a move in either direction.
Dell Technical Outlook
Overall, Dell Technologies currently presents a bullish longer-term structure with short-term momentum still resetting. The broader uptrend remains the dominant technical picture, RSI has cooled from overbought without breaking down.
The key technical development to watch is therefore a combination of the $415-$420 support zone holding and a decisive move back through the $500-$510 resistance area. If both align, they would provide stronger confirmation of a continuation towards new highs.
The TipRanks analyst outlook adds a supportive longer-term perspective, with the majority of analysts positioned on Buy and an average 12-month price target of $529.18.
For traders, the primary focus remains on price structure, the $415-$420 and $500-$510 boundaries, and RSI momentum. For investors, these technical signals can be considered alongside the broader analyst outlook when assessing the longer-term direction of Dell.

Tradable assets:
Min.Deposit:
Max Leverage:
FCA:

Rating:
 Earnings Calendar
  Economic Calendar
  VAT Calculator
  Tax Free Childcare Calculator
 Percentage Calculator
 Compound Interest Calculator
  Loan Overpayment Calculator
 Mortgage Calculator
 Credit Card Calculator
 Investing
  Economics
 Trading
  Technical Analysis
  Personal Finance
 Calculator