News
Tesla and SpaceX Merger: What It Could Mean for Investors and Stock Prices
22 Oct 2026, 10:30


Join Minipip Academy and access free courses in investing, trading, economics, and more.
Sign Up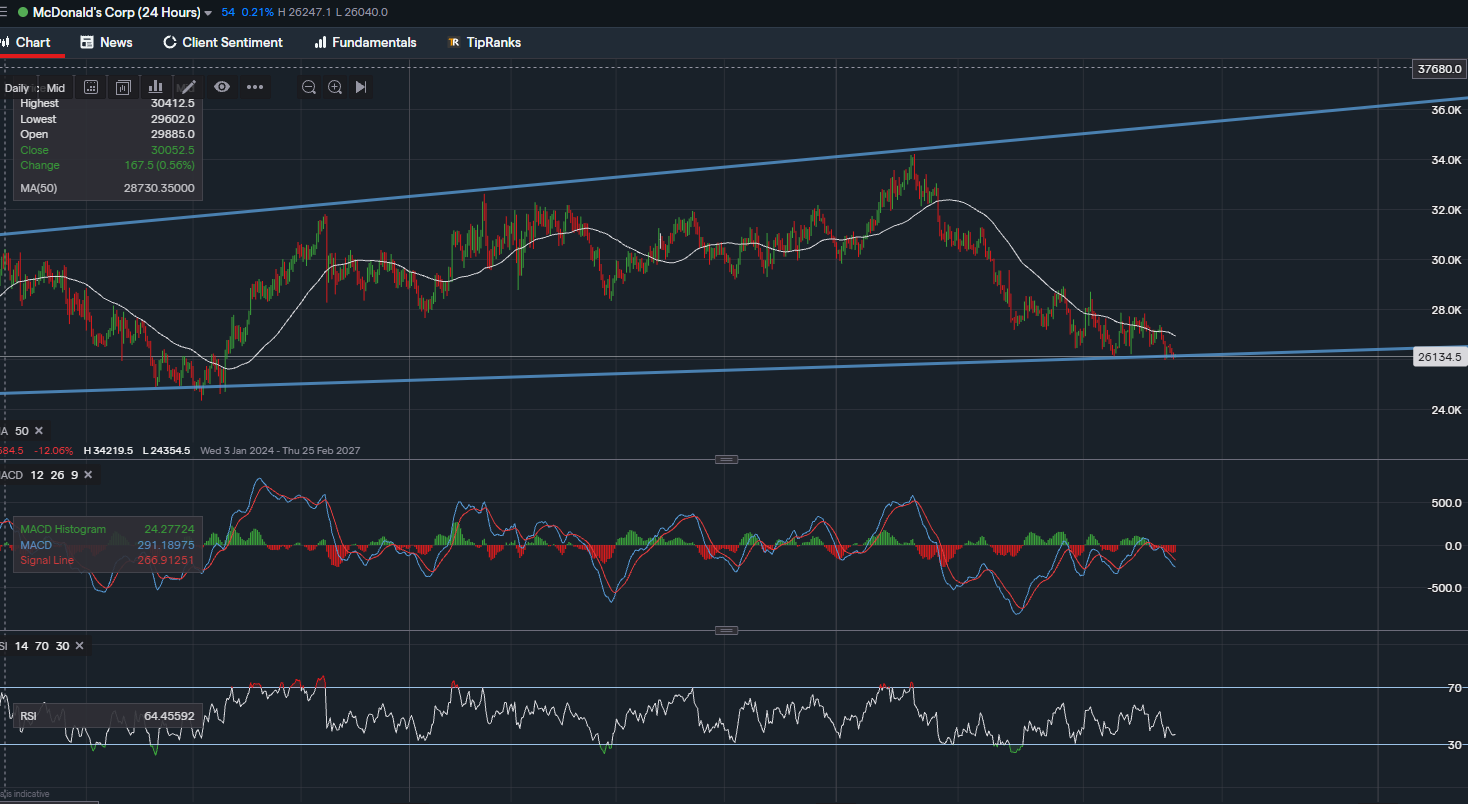
McDonald's at a Crossroads: Price Tests Its Rising Trendline Near 52-Week Lows


McDonald's (MCD) Technical & Fundamental Update
McDonald's is currently trading within a broader downtrend structure, having spent 2026 grinding lower from its March high near $341.75 down to current levels around $260.95. That puts the stock right at the bottom of its 52-week range and just above its 52-week low of $259.85. Rather than a sharp, sudden move, this has been a steady, sustained decline, and the stock is now sitting at a genuinely important technical juncture.
Momentum Indicators Show a Weak but Not Yet Oversold Picture
Momentum readings are giving a cautious, still negative signal, though not an extreme one. RSI(14) currently sits at 42.45, which is neutral leaning bearish. Notably, this is not yet in oversold territory below 30, even with the stock trading near 52-week lows. That's a useful detail on its own. It tells us the recent slide has been a gradual bleed rather than a sharp capitulation, and there's technically still room for RSI to fall further before the stock would be considered oversold on a daily basis.
MACD(12,26) currently reads negative, with the MACD line running below the signal line. This confirms that downside momentum remains in control for now, and there is no bullish crossover yet to suggest the selling pressure is easing.
The Current Range Is the Key Decision Zone
Price has been sliding through a series of lower highs and lower lows for most of the year, and every major moving average, the 5-day, 20-day, 50-day, 100-day and 200-day, currently sits above the current price. That's a textbook bearish alignment, and it means MCD is trading below trend on every timeframe that matters for short and medium-term positioning.
The immediate resistance to watch sits in the $265 to $267 zone, where the 5-day and 50-day moving averages currently cluster. This is the first real hurdle for any recovery attempt. Above that, a broader resistance shelf sits around $276 to $280, marking the top of the previous consolidation range earlier in the year.
On the downside, the $259.85 level, the current 52-week low, is the immediate support to watch. A break below this would be significant, since it would take the stock into territory not seen in several years, with no obvious support shelf until much lower levels.
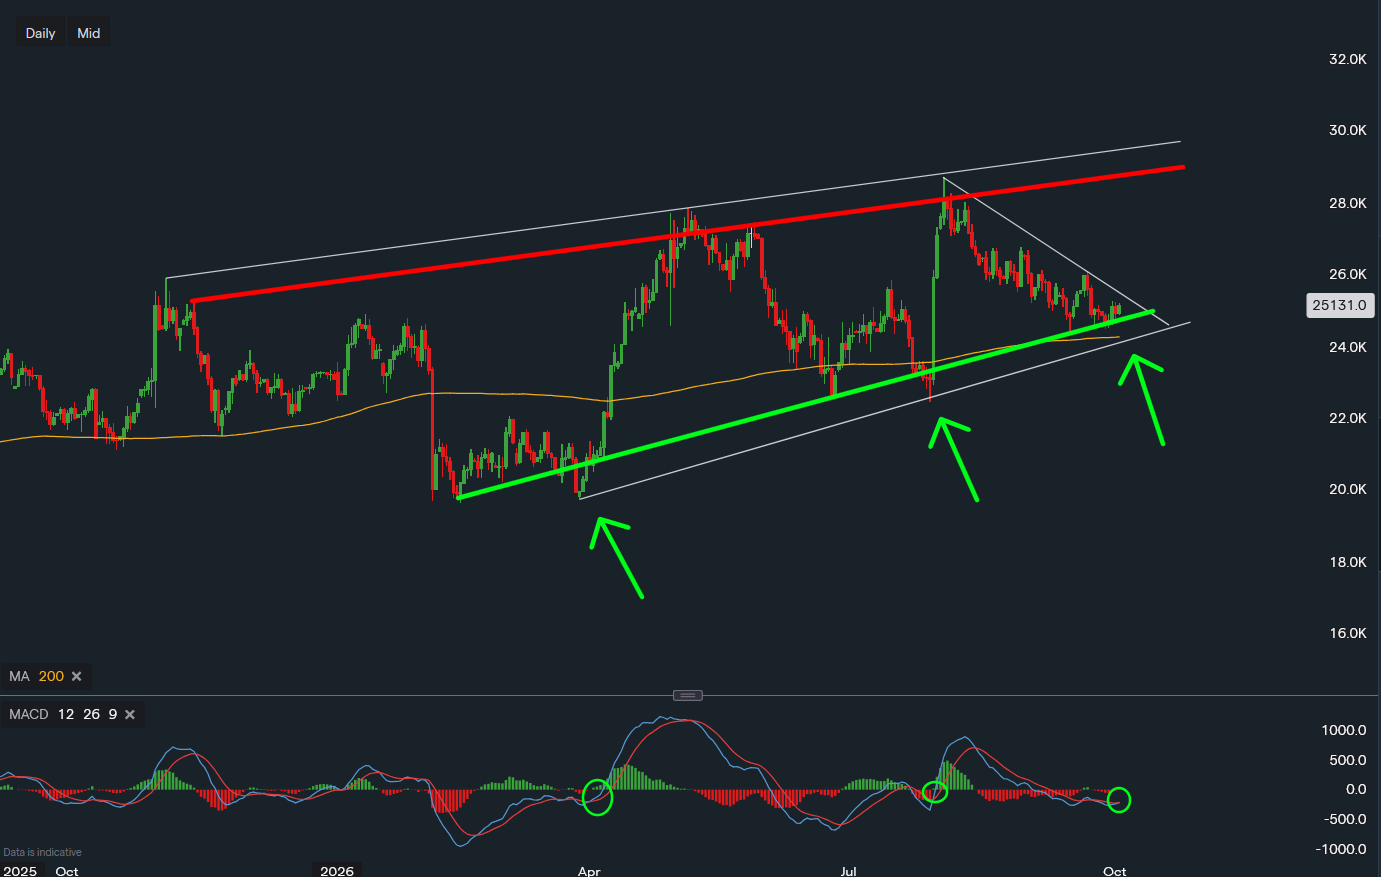
The daily chart tells the same story from a slightly different angle. Since early 2024, McDonald's has been climbing and falling within a rising channel, marked out by an ascending support line running up from the January 2024 low. Price has now fallen all the way back down to that support line, and the two are converging almost exactly at current levels.
This support line matters because it's been respected multiple times over the past two years. Every time price has pulled back to it, buyers have stepped in and pushed the stock higher again. That history is what makes the current test so important. If the line holds again, it would fit the pattern seen repeatedly since 2024 and could mark the base of a recovery. If price breaks cleanly below it instead, that would be the first time the trend has genuinely failed, and it would open the door to a deeper move lower with far less support underneath..
Fundamentals Provide Some Longer-Term Support
The share price trades on a P/E of 21.20, and a forward P/E of 19.66. Both of those are cheaper than MCD's own typical long-term average. In simple terms, the business itself hasn't gotten worse anywhere near as fast as the share price has fallen, so investors are currently paying less for the same earnings than they usually would.
Analyst Outlook Supports the Longer-Term Picture
The technical structure can also be viewed alongside the current analyst outlook. Coverage from 34 analysts shows an average rating of Buy, with a 12-month average price target of $315.39, around 20.9% above the current share price.
This forecast does not determine the technical direction of the stock, but it provides useful longer-term context. The analyst outlook remains broadly constructive even as the technical chart shows a clear short and medium-term downtrend. The important distinction, as always, is that the analyst forecast represents an expectation rather than a confirmed future price. The technical structure will ultimately need to validate any recovery before it can be considered confirmed.
McDonald's Technical Outlook
Overall, McDonald's currently presents a bearish short and medium-term structure sitting right on top of a longer-term support line that is now being tested for the first time in this trend. Every daily moving average points lower, MACD remains negative, and RSI, while weak, has not yet reached oversold extremes.
The key technical development to watch is therefore whether the $259.85 support and the rising trendline hold together. If they do, it would offer the first real technical evidence that this extended decline is running out of momentum.
The analyst outlook adds a supportive longer-term perspective, with the majority of coverage positioned on Buy and an average 12-month price target of $315.39. The fundamentals, steady revenue and earnings growth, a below average P/E, and a multi-year high dividend yield, provide additional context for why the longer-term view remains more constructive than the near-term chart.
Disclaimer:
This analysis is provided for informational and educational purposes only and should not be interpreted as financial advice.

Tradable assets:
Min.Deposit:
Max Leverage:
FCA:

Rating:
 Earnings Calendar
  Economic Calendar
  VAT Calculator
  Tax Free Childcare Calculator
 Percentage Calculator
 Compound Interest Calculator
  Loan Overpayment Calculator
 Mortgage Calculator
 Credit Card Calculator
 Investing
  Economics
 Trading
  Technical Analysis
  Personal Finance
 Calculator