Netflix (NASDAQ: NFLX) Technical Analysis – Daily Chart Outlook
$67.84
17 Jul 2026, 15:35
Neutral

Join Minipip Academy and access free courses in investing, trading, economics, and more.
Sign Up
The MACD is another very popular trading indicator that uses moving averages to track the momentum of an asset. The MACD is calculated by subtracting the 26-period EMA from the 12-period EMA. The result of this calculation is known as the MACD line. An additional 9-day EMA is also plotted onto the graph, and this is known as the ‘signal line’
Generally speaking, when the ‘signal line’ crosses above the MACD line this is an indication to buy and when the ‘signal line’ crosses below the MACD line this is an indication to sell (or short).
An Example of this is below:
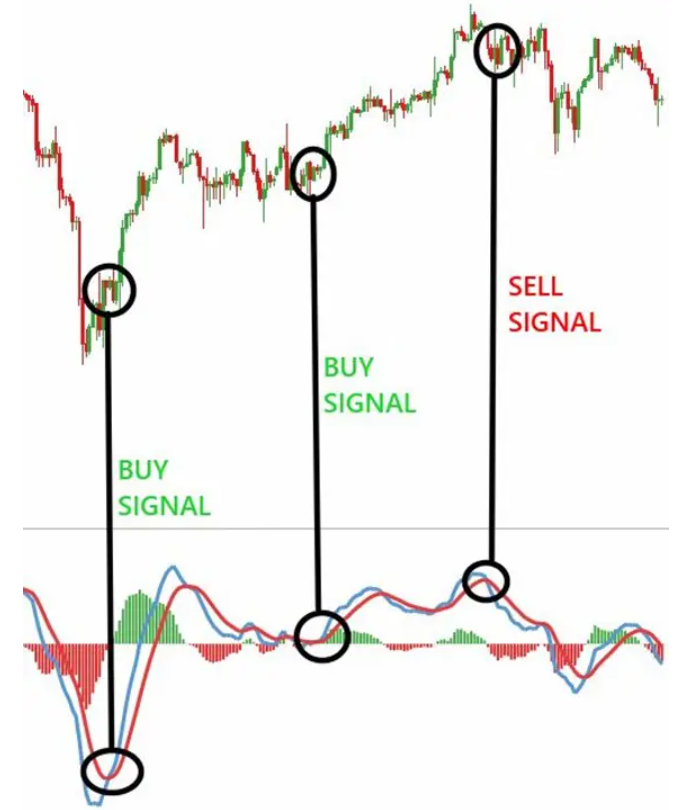
As the diagram shows here, when the blue MACD line crosses over the red ‘signal line’ this would be a suggestion to buy this asset. Vice versa, when the blue MACD line crosses below the red ‘signal line’ this would be a signal to either short or sell trade.

Tradable assets:
Spread Betting, CFDs, ISAs, Managed Portfolios, Share Dealing
Rating:
FCA: 
 Earnings Calendar
  Economic Calendar
  VAT Calculator
  Tax Free Childcare Calculator
 Percentage Calculator
 Compound Interest Calculator
  Loan Overpayment Calculator
 Mortgage Calculator
 Credit Card Calculator
 Investing
  Economics
 Trading
  Technical Analysis
  Personal Finance
 Calculator