UnitedHealth Group Analysis: Defensive Healthcare Scale Amid Regulatory and Margin Pressures
$407.34
12 Jun 2026, 17:06
Neutral

Join Minipip Academy and access free courses in investing, trading, economics, and more.
Sign Up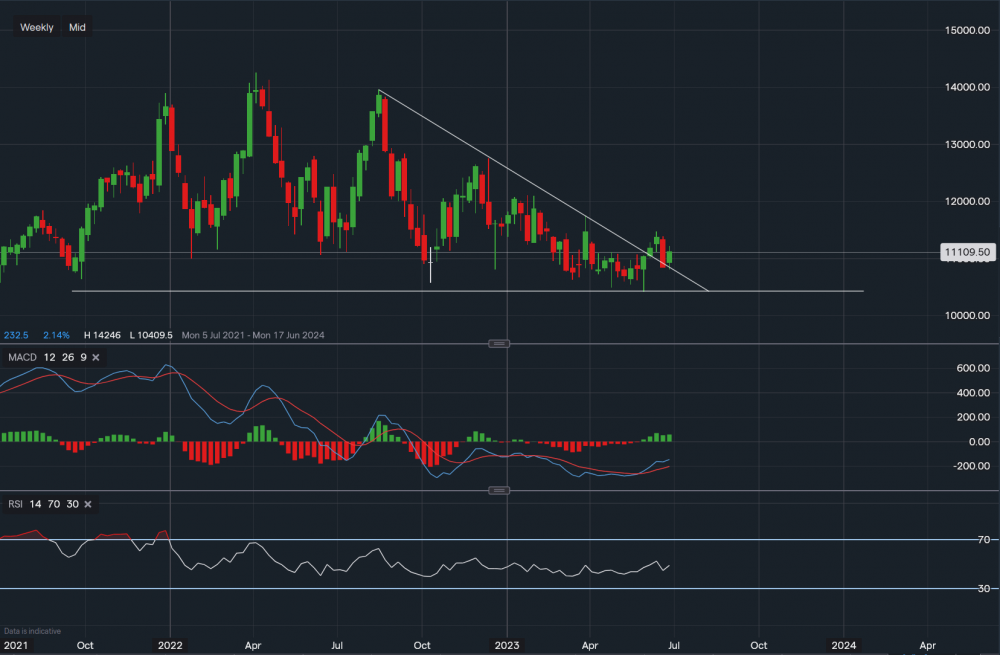
Chart & Data from IG
Paychex is another player who is due to report earnings tomorrow. Looking at the chart from a technical viewpoint, we can see that the price on the weekly timeframe has broken out of the descending triangle. Currently trading at around $111.09 a share. The base has been established along the horizontal trendline, or respectively at $104.09. A dip below this level could see a move lower towards the range of $95-$98. On the other hand, let’s take a look at the upside potential since a break has occurred. Resistance sits at $114.62 then at $117.43 and then at $120.92. A break and close above $120.92 may see the price climb even higher towards $126-$127 a share. Although, this is more likely in the mid-long term and could be influenced by the earnings report tomorrow. Over to the technical indicators, MACD is positive but RSI is still neutral as it reads 48.

Tradable assets:
Min.Deposit:
Max Leverage:
FCA:

Rating:
 Earnings Calendar
  Economic Calendar
  VAT Calculator
  Tax Free Childcare Calculator
 Percentage Calculator
 Compound Interest Calculator
  Loan Overpayment Calculator
 Mortgage Calculator
 Credit Card Calculator
 Investing
  Economics
 Trading
  Technical Analysis
  Personal Finance
 Calculator


