Visa (NYSE:) Technical Analysis: Earnings in Focus as Bullish Momentum Builds
$364.68
28 Jul 2026, 15:59
Neutral

Join Minipip Academy and access free courses in investing, trading, economics, and more.
Sign Up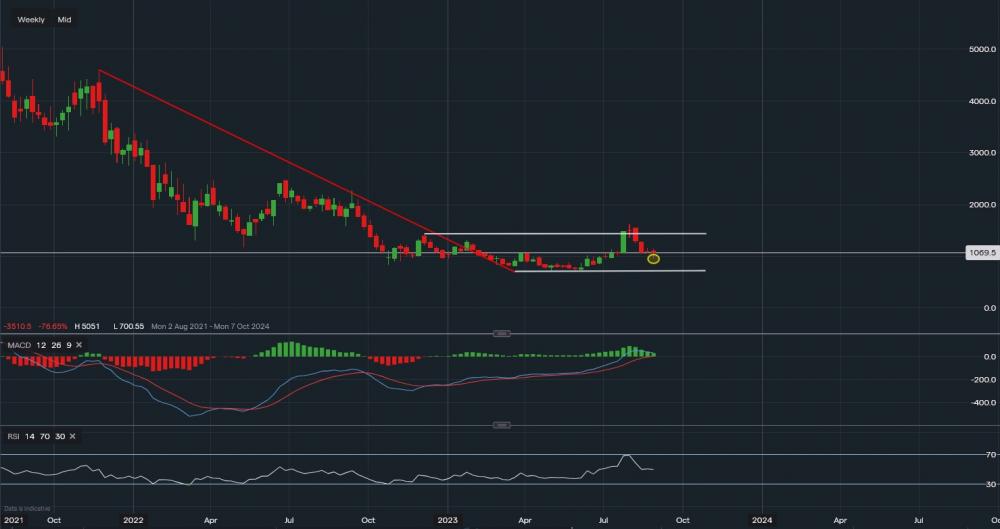
Chart & Data from IG
NIO currently trading at around $10.69 a share, it reached $16.17 back in July following a breakout. Based on a weekly timeframe, we can see that a support base has been established at $7.00 which allowed the price to consolidate. This then led to a break higher moving above the resistance of $14,33, however, the price since then has retraced after some profit-taking. The bearish trend dating back to November has now technically been broken (red trendline), with the new key resistance level of $16.17. Looking deeper into the chart, we can see that the stock is trying to form some support around $9.46- $10.74 (yellow oval). These levels are this week’s low and March’s resistance, hence, the price is currently trying to form support in between. If there is consolidation, we would then look towards those resistance levels once again sitting at $12.37, $13,21, and then back to $14.33. Towards the downside, support sits at $9.46 and of course then the key level of $7.00. The technical indicators suggest a neutral approach as the MACD is flat and the RSI reads 49.

Tradable assets:
Min.Deposit:
Max Leverage:
FCA:

Rating:
 Earnings Calendar
  Economic Calendar
  VAT Calculator
  Tax Free Childcare Calculator
 Percentage Calculator
 Compound Interest Calculator
  Loan Overpayment Calculator
 Mortgage Calculator
 Credit Card Calculator
 Investing
  Economics
 Trading
  Technical Analysis
  Personal Finance
 Calculator


