Analysis
The Budget So Boring, Markets Loved It
$107
29 Oct 2026, 17:07
Neutral


Join Minipip Academy and access free courses in investing, trading, economics, and more.
Sign Up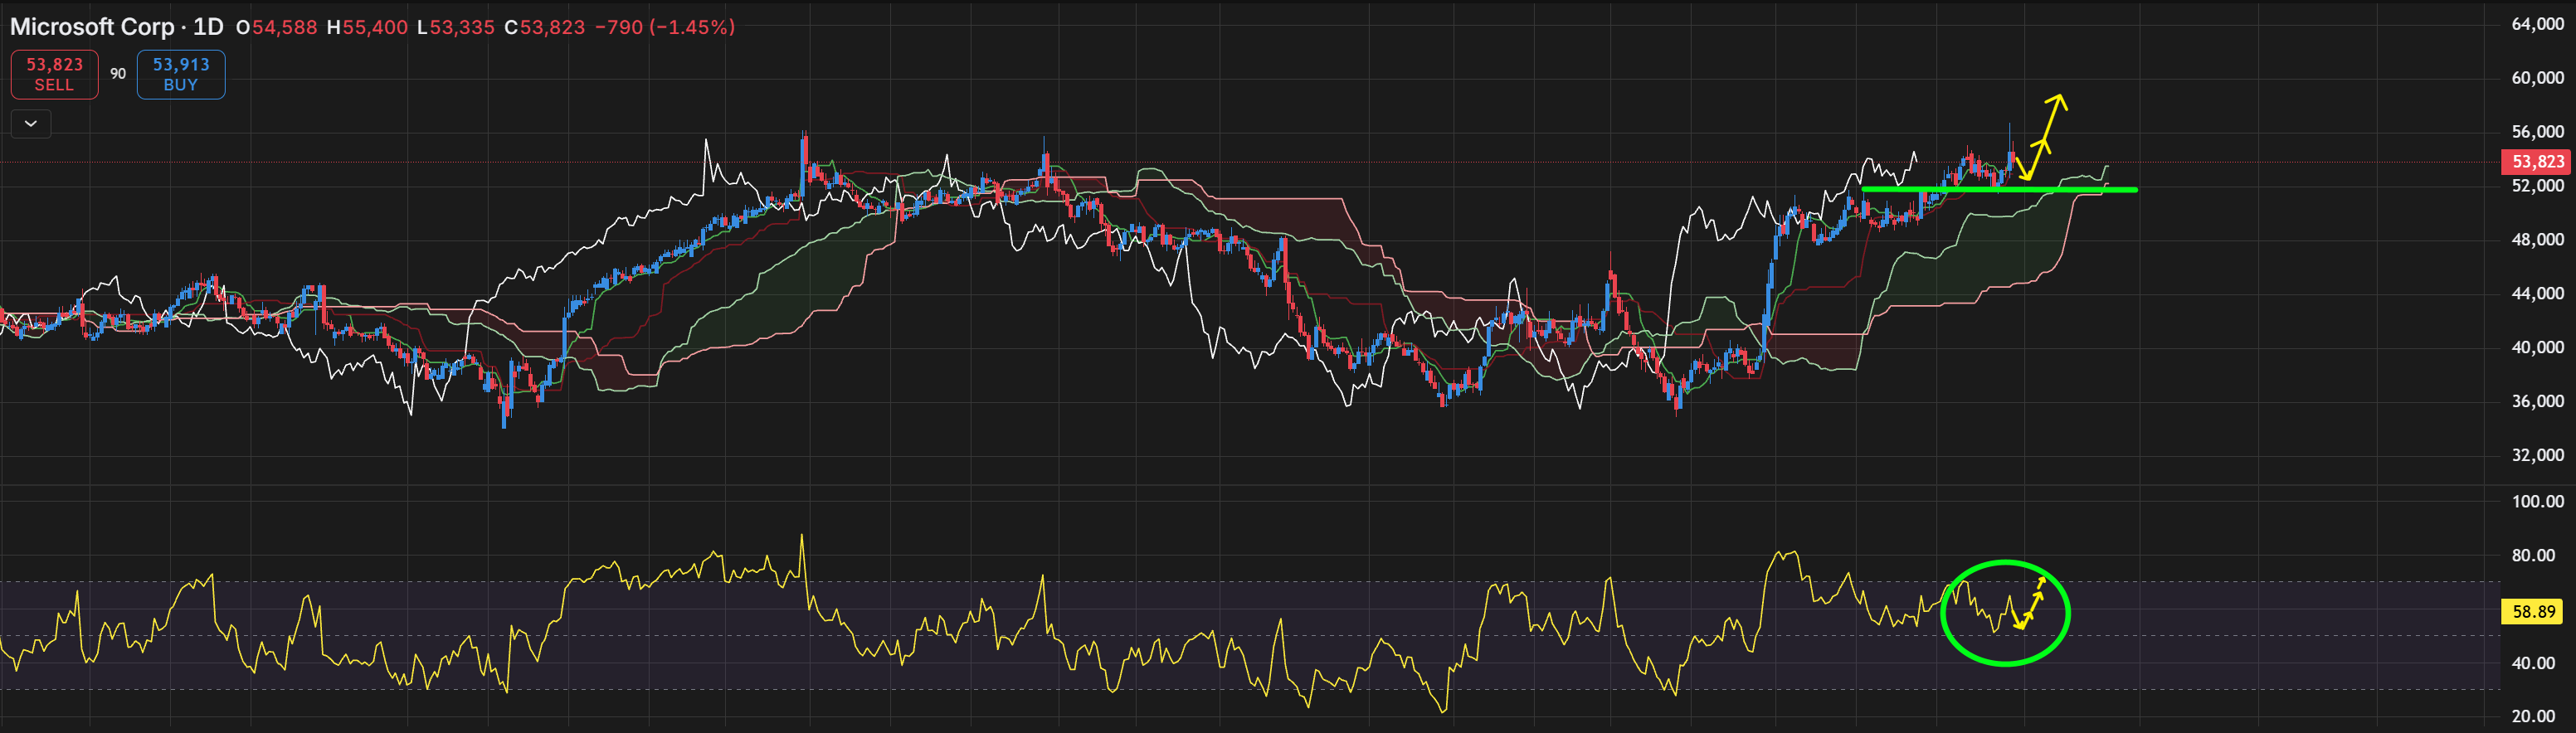
Capital Data - Timeframe - 1D


Microsoft Corporation (NASDAQ: MSFT) is entering a new phase following its latest earnings release on Wednesday, 28 October 2026. The technology giant delivered stronger-than-expected quarterly results, supported by continued growth in cloud computing and artificial intelligence. However, the next question for traders is whether the positive results can translate into sustained buying momentum.
The daily chart provides an interesting picture. Using the Ichimoku Cloud and Relative Strength Index (RSI), MSFT appears to retain a constructive technical structure, although the latest price action suggests that a period of consolidation or a short-term pullback remains possible.
With the earnings announcement now behind it, attention turns to whether Microsoft can hold its recent support area and build enough momentum to challenge its previous highs.
Microsoft Earnings Results: Strong Cloud Growth Supports the Outlook
Microsoft reported revenue of $92.3 billion for the first quarter of fiscal 2027, representing year on year growth of 19%. Adjusted earnings per share came in at $4.89, up 18% from the previous year, while Microsoft Cloud revenue increased by 30% to $63.9 billion. Azure revenue also recorded impressive growth of 48%. These figures exceeded expectations for revenue, operating income and earnings per share.
The results highlight the continued importance of cloud computing and artificial intelligence to Microsoft's business. Strong demand across these areas could help support the company's longer-term growth prospects, although investors will continue to assess the costs associated with expanding AI infrastructure and the returns generated by those investments.
Despite the encouraging figures, strong earnings do not automatically guarantee a sustained share price advance. Markets often respond to the difference between reported results and what investors had already anticipated. Forward guidance, future growth expectations and the price action following the announcement will therefore remain important considerations.
The initial after-hours market reaction was positive, with MSFT trading higher following the release. The next step is to see whether that interest continues into regular trading and whether the stock can establish a stronger position above its recent technical levels.
What the Ichimoku Cloud and RSI Is Telling Us
On the supplied daily chart, MSFT is trading above the Ichimoku Cloud. This is generally considered a constructive technical development because price is positioned above the area that helps define the broader trend. The projected cloud also appears green, suggesting that the forward-looking cloud structure remains supportive rather than immediately signalling a bearish shift.
However, trading above the cloud does not mean that price must continue rising without interruption. Following a strong advance, it is common for a stock to pause, retest support or move sideways before establishing its next direction.
The green horizontal level around $520 is particularly important on the displayed chart. It represents an area to monitor if Microsoft experiences a pullback after its earnings release. A retracement towards this region could help determine whether buyers remain willing to defend the recent recovery.
If the price approaches this area and subsequently stabilises, it could indicate that the previous breakout structure remains intact. Renewed buying interest from that region would strengthen the possibility of another attempt towards the recent highs.
On the other hand, a decisive move below the $520 area would weaken the current technical picture. Further downside could then bring the lower portion of the Ichimoku Cloud into focus, with the precise support level depending on how the cloud develops.
For now, the cloud suggests that the broader structure remains constructive, but the market still needs to demonstrate that it can sustain the post-earnings recovery.
The Relative Strength Index (RSI) offers another perspective on Microsoft's current position.
On the supplied chart, the RSI is approximately 58.89. This places the indicator above the neutral 50 level but below the conventional overbought threshold of 70. In simple terms, recent momentum remains on the bullish side of neutral, although the indicator is not showing an extreme reading.
The RSI is particularly useful in the current situation because it can help distinguish between a temporary pause in the price advance and a more substantial loss of momentum.
If the RSI continues moving higher while MSFT holds above its key support area, this could suggest that buying pressure is rebuilding. A stronger RSI reading accompanied by a break above recent price resistance would provide additional evidence that the recovery may have further room to develop.
Alternatively, if the RSI begins turning lower and falls towards or below 50, it could indicate that bullish momentum is fading. If this coincides with a price rejection near resistance or a break below support, the possibility of a deeper pullback would become more relevant.
It is worth remembering that the RSI can remain elevated during a strong uptrend and can fluctuate significantly following an earnings announcement. The indicator is therefore best assessed alongside price action and the Ichimoku Cloud rather than used as an independent trading signal.
The immediate focus is whether MSFT can maintain its constructive daily chart structure following the earnings release.
The first area to monitor is support around $520, marked by the green horizontal line on the supplied chart. A successful retest could provide evidence that buyers are continuing to defend the previous breakout region. If price stabilises there and the RSI begins to turn upwards, the combination would support a potential recovery scenario.
On the upside, the 550–554 region is an important area to watch, based on the recent highs visible on the chart and the post-earnings price range. A sustained move above this region could indicate that buying pressure is strong enough to overcome the recent resistance.
However, if Microsoft struggles to maintain momentum below those highs, further consolidation could develop. A pullback towards $520 would not necessarily invalidate the broader recovery, provided that the price structure and support remain intact.
A sustained break below $520 would present a different picture. It could signal that the recent advance is losing strength and that the market may need to explore lower support levels before a clearer direction emerges.
These levels are potential areas of interest rather than guaranteed turning points. Earnings-related volatility can cause price to move rapidly through technical levels, particularly when the market is reassessing future growth expectations.
Microsoft's latest earnings report provides a positive fundamental backdrop, with revenue growth, cloud performance and adjusted earnings all exceeding expectations. The technical picture, meanwhile, suggests that the broader recovery remains constructive, with the share price positioned above the Ichimoku Cloud and the RSI currently near 58.89.
The next stage will depend on whether buyers can maintain that momentum after the initial earnings reaction.
In a bullish scenario, MSFT could consolidate above the $520 support region before attempting another move towards the 550–554 resistance area. A stronger RSI reading and continued price action above the cloud would help support this possibility.
In a more cautious scenario, the stock could experience a deeper pullback if momentum weakens or investors begin reassessing the outlook despite the strong results. A break below support, particularly alongside a declining RSI, would warrant closer attention.
For now, Microsoft remains at an interesting technical point. The earnings results have provided encouraging fundamental news, but the market's ability to sustain the recovery will be just as important as the headline figures.
Disclaimer
This analysis is for informational purposes only and should not be considered financial advice. Investors and traders should conduct their own research and consider individual risk tolerance before making any investment decisions.

Tradable assets:
Min.Deposit:
Max Leverage:
FCA:

Rating:
 Earnings Calendar
 Economic Calendar
 VAT Calculator
 Tax Free Childcare Calculator
 Percentage Calculator
 Compound Interest Calculator
 Loan Overpayment Calculator
 Mortgage Calculator
 Credit Card Calculator

 Investing
 Economics
 Trading
 Technical Analysis
 Personal Finance
 Calculator