Analysis
ServiceNow Stock Technical Analysis: NOW Coils for High-Stakes Earnings Breakout
$158.18
27 Oct 2026, 13:59
Neutral


Join Minipip Academy and access free courses in investing, trading, economics, and more.
Sign Up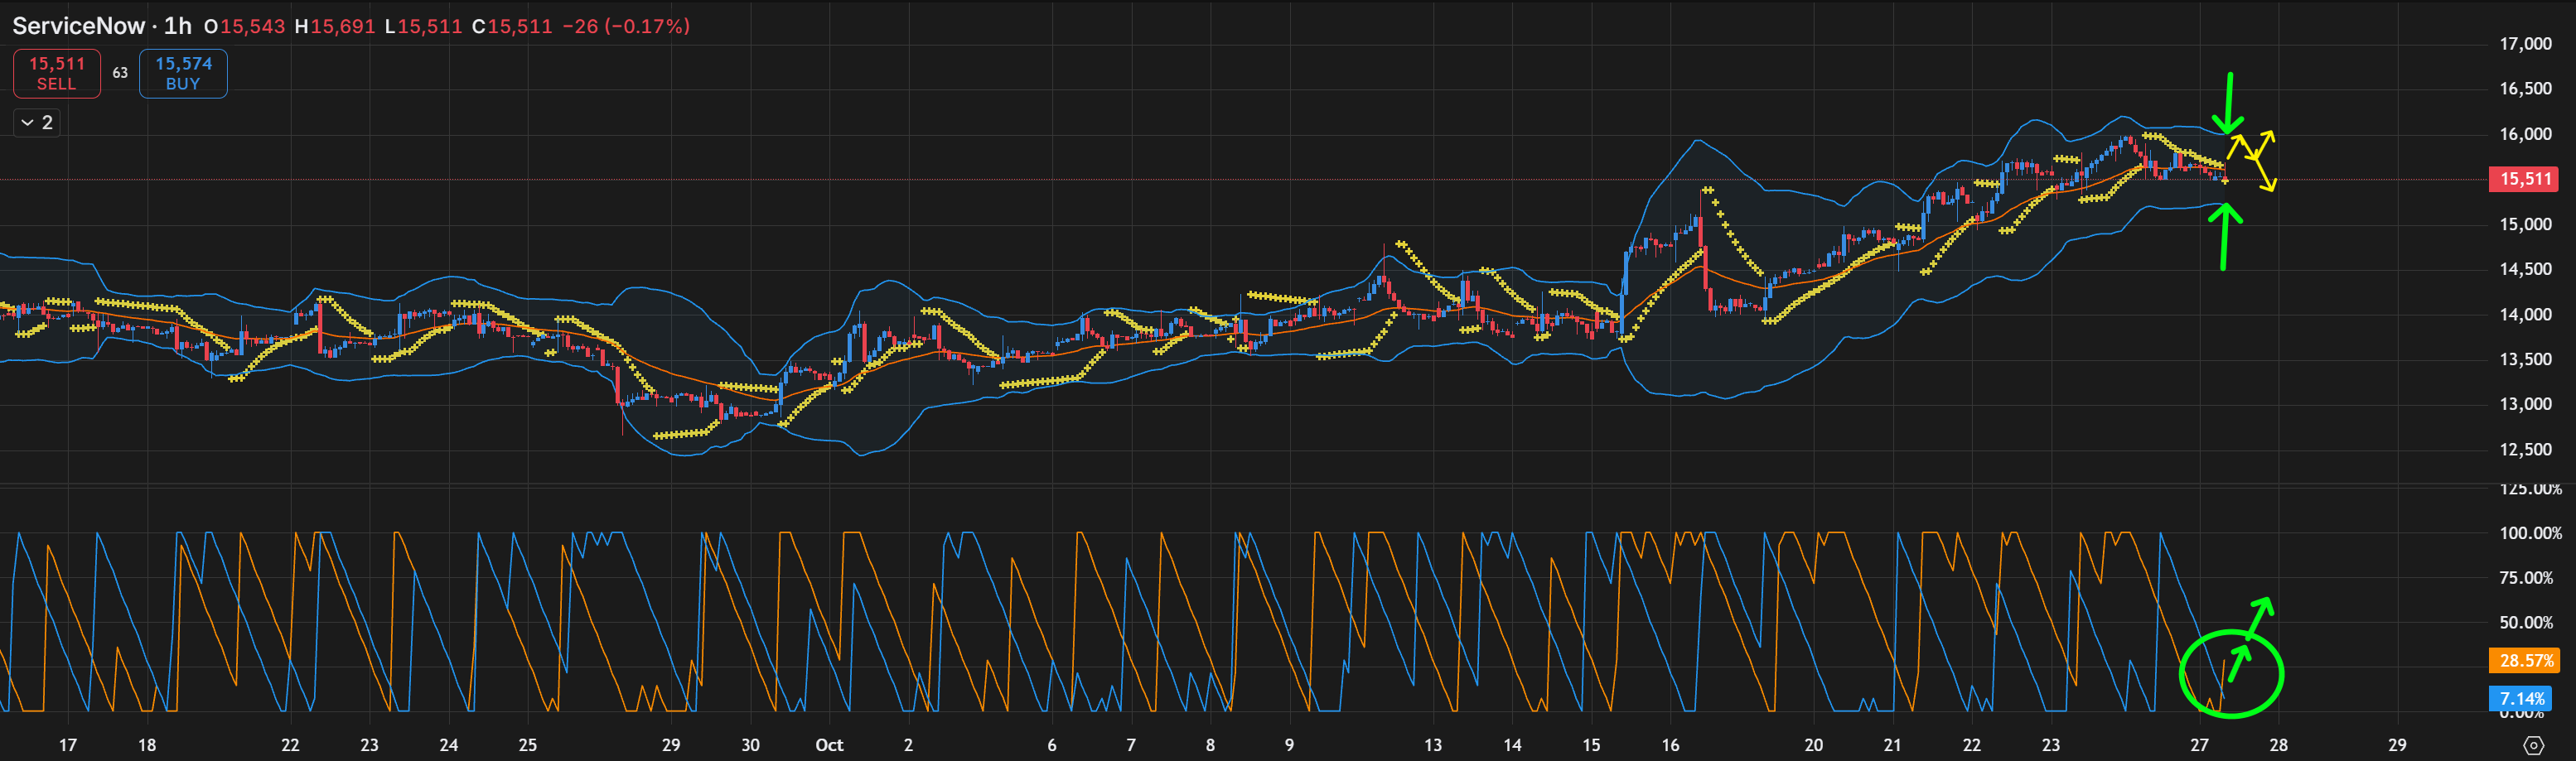
Capital data - 1H


Analyzing the asset through the lens of Bollinger Bands reveals an overextended bullish trend that is rapidly pivoting into a classic volatility squeeze. Throughout the latter half of October, price action consistently hugged and expanded the Upper Bollinger Band, signaling aggressive institutional accumulation. However, the final trading windows on the chart show a distinct mean-reversion move, with candlesticks pulling back from the upper ceiling toward the twenty-period moving average basis line. As the boundaries of the bands begin to contract at the absolute edge of the timeframe, it proves that short-term price variance is being heavily suppressed, a phenomenon that historically precedes a massive directional gap.
Parabolic SAR Triggers Intraday Trend Reversal
This tactical cooling phase is further validated by the Parabolic Stop and Reverse indicator, which has triggered a fresh near-term bearish shift. For the majority of the recent upward rally, the trailing parabolic dots remained safely anchored beneath the candlesticks, providing a reliable floor for trailing long positions. The latest hourly bars have broken beneath this threshold, causing the yellow dots to migrate above the price action. This mechanical flip constitutes a clear intraday sell signal, confirming that the immediate buying momentum has stalled and the stock has shifted into a defensive, preparatory consolidation phase ahead of the earnings call.
Aroon Indicator Confirms Buying Pressure Exhaustion
Simultaneously, the Aroon indicator is flashing a stark momentum divergence that traders must not ignore. Looking closely at the lower momentum panel, the historical relationship between the Aroon Up and Aroon Down lines has been characterized by high-frequency trend chops. At the current hard right edge, the orange Aroon Up line is plunging vertically toward the zero percent floor, while the blue Aroon Down line is beginning to tick upward. This rapid decay in the Aroon Up metric confirms that the previous multi-day highs are losing their temporal freshness, illustrating a distinct exhaustion of immediate buying pressure on this specific intraday time horizon.
High-Beta Earnings Catalyst Amplifies Strategic Trading Risks
This technical consolidation directly collides with demanding fundamental expectations, as Wall Street's active hurdle for the Q3 report sits at an adjusted earnings per share of one dollar and two cents on revenues of four billion and ninety million dollars. Because ServiceNow commands a premium multiple, merely meeting these headline figures will likely prove insufficient to sustain the stock’s recent upward trajectory. Instead, the ultimate post-earnings trend resolution will depend heavily on management's forward guidance and the commercial scale of their agentic artificial intelligence implementations, creating a high-gamma environment where a bullish breakout could easily target the one hundred and seventy-five dollar window, while an earnings miss threatens a swift technical retracement back to the lower Bollinger Band support floor near one hundred and forty dollars.
Disclaimer
This analysis is for informational purposes only and should not be considered financial advice. Investors and traders should conduct their own research and consider individual risk tolerance before making any investment decisions.

Tradable assets:
Min.Deposit:
Max Leverage:
FCA:

Rating:
 Earnings Calendar
 Economic Calendar
 VAT Calculator
 Tax Free Childcare Calculator
 Percentage Calculator
 Compound Interest Calculator
 Loan Overpayment Calculator
 Mortgage Calculator
 Credit Card Calculator

 Investing
 Economics
 Trading
 Technical Analysis
 Personal Finance
 Calculator