Analysis
ServiceNow Stock Technical Analysis: NOW Coils for High-Stakes Earnings Breakout
$158.18
27 Oct 2026, 13:59
Neutral


Join Minipip Academy and access free courses in investing, trading, economics, and more.
Sign Up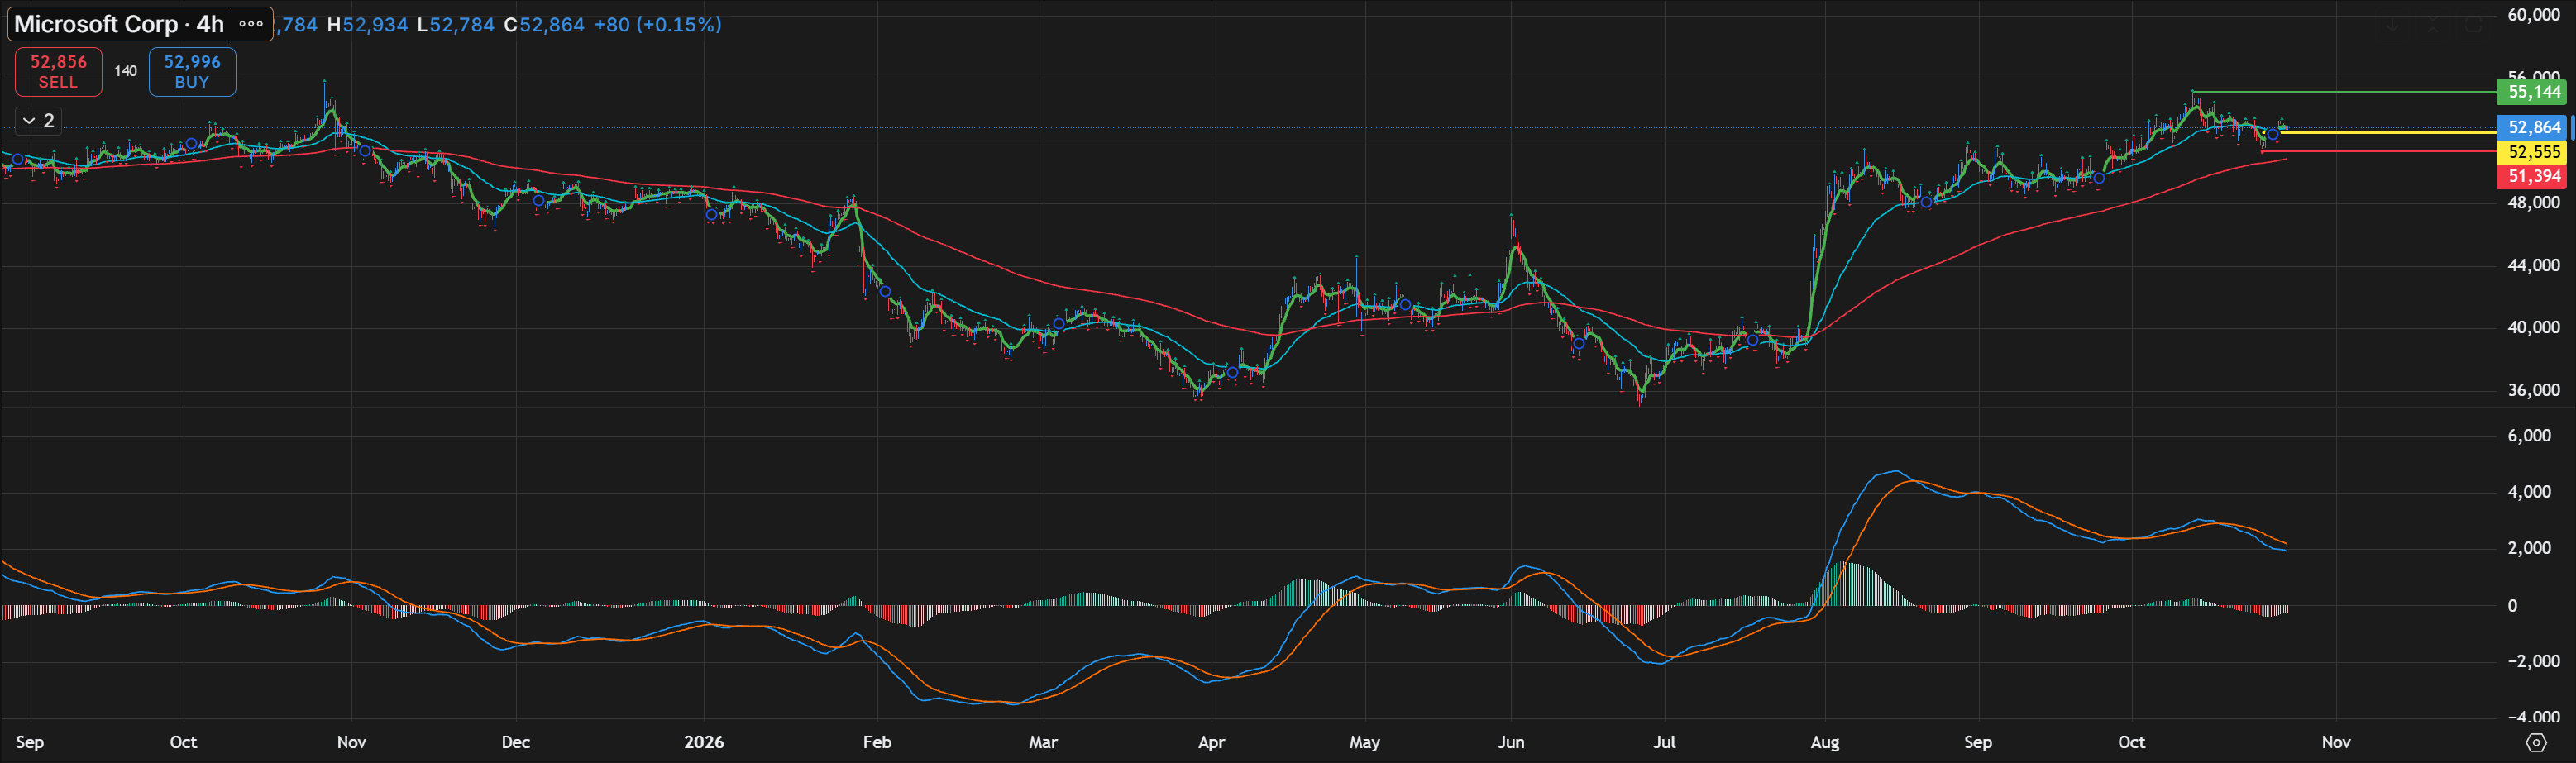
Data from Capital - 4H


Microsoft Corporation (MSFT) is showing signs of short-term consolidation on the 4-hour chart following a strong recovery that began in August. After advancing towards its recent highs, the share price has started to lose some upward momentum, raising the possibility of a pullback before its next significant move. With Microsoft's quarterly earnings report scheduled for Wednesday, 28 October 2026, the market could be approaching an important turning point. The focus is now on whether price can maintain its current technical structure and attract renewed buying interest, particularly if the upcoming results are well received by investors.
What the Moving Averages Tell Us About Microsoft's Next Move
The three moving averages on the 4-hour chart provide a useful picture of Microsoft's current price structure. Although the shorter-term averages have begun to flatten as price consolidates, MSFT remains above the longer-term red moving average, positioned around 51,394 on the displayed chart. This suggests that the broader recovery remains intact, even as short-term momentum begins to cool.
The yellow horizontal level around 52,555 is an important area to monitor. With price currently near 52,844, a retracement towards this zone could provide an opportunity to assess whether buyers are prepared to defend the recent gains. If the area holds as support and buying pressure returns, the stock could potentially regain upward momentum and revisit its recent highs. However, if price breaks decisively below this level, further weakness could develop, bringing the longer-term moving average around 51,394 into focus as a potential area of support.
On the upside, the green horizontal level around 55,144 represents a potential resistance area should bullish momentum return. A move towards this level would likely require stronger buying interest and a favourable response to the earnings announcement. For now, the chart suggests that MSFT is consolidating after its recent advance, with the next directional move potentially influenced by both technical developments and the upcoming financial results.
The Moving Average Convergence Divergence (MACD) indicator provides further insight into the recent slowdown. Following Microsoft's strong upward move in August, the MACD lines rose significantly, reflecting the strength of the bullish momentum at that time. More recently, however, both lines have started to turn lower, while the histogram has moved into negative territory. This suggests that the upward momentum has weakened in the short term.
Although this does not necessarily signal a reversal of the broader recovery, it does leave room for further consolidation or a potential pullback. If the MACD lines begin to stabilise and turn upwards, accompanied by a return to positive histogram bars, this could indicate that buying momentum is beginning to rebuild. Such a development, particularly if it coincides with price holding above the yellow support area, would strengthen the technical case for a possible continuation higher.
Conversely, continued deterioration in the MACD alongside a break below support could point towards a deeper retracement. The indicator is therefore worth monitoring alongside price action and the moving averages, rather than treating it as a standalone signal. With earnings approaching, the MACD could also change direction quickly as new information enters the market.
Microsoft Earnings on 28 October: What Could It Mean for MSFT?
Microsoft's upcoming earnings report could be a key catalyst for its next significant price move. The company is scheduled to release its fiscal 2027 first-quarter results after the US market closes on Wednesday, 28 October 2026. Based on the analyst forecast information provided, earnings are expected to increase by approximately 14%. If the reported results meet or exceed expectations and management provides a positive outlook, the announcement could encourage renewed buying interest.
In a bullish scenario, a favourable market reaction could help MSFT maintain support around the yellow level at 52,555 before attempting to move higher. If momentum strengthens, the stock could potentially revisit its recent highs, with the green resistance area around 55,144 representing a further level of interest. However, this remains a conditional scenario rather than a confirmed outcome, as the market's reaction will depend on the results and the expectations already reflected in the share price.
It is also important to recognise that positive earnings do not automatically translate into a higher share price. Investors will be paying attention to revenue growth, cloud computing performance, artificial intelligence demand, profit margins and management's forward guidance. Even if Microsoft reports stronger earnings, the stock could come under pressure if the results fall short of elevated expectations or the outlook disappoints.
The earnings announcement could therefore bring increased volatility, potentially causing price to move sharply in either direction. How MSFT behaves around its key support and resistance levels after the announcement may provide a clearer indication of whether the recent recovery has room to continue or whether a more substantial correction is developing.
TipRanks Outlook: Why Analysts Remain Optimistic About Microsoft
The TipRanks analyst figures provided indicate a positive overall outlook for Microsoft. According to those figures, 34 analysts have assigned Buy ratings, with none voting Sell, while the overall rating score is reported as 36. The supplied outlook also extends towards October 2027, suggesting that the analysts represented in these figures see potential for longer-term strength.
This positive consensus may reflect confidence in Microsoft's established software business, cloud computing operations and continued investment in artificial intelligence. However, analyst ratings are based on expectations and assumptions that can change as new financial information becomes available. They should therefore be considered alongside the company's actual performance and the prevailing market conditions.
The reported score of 36 should also be verified against the current TipRanks listing before publication, as the scale and meaning of a rating score are important to interpreting the figures accurately. Analyst sentiment can provide useful background, but it does not guarantee future price performance or determine the direction of the next move on the 4-hour chart.
MSFT Price Outlook: Key Levels to Watch After Earnings
Overall, Microsoft's 4-hour chart presents an interesting technical setup ahead of its earnings announcement. The broader recovery remains visible, with price trading above the longer-term moving average, although the MACD suggests that short-term bullish momentum has begun to fade. This combination leaves open the possibility of a pullback towards the yellow support area around 52,555 before the market establishes its next direction.
If this level holds and momentum begins to improve, MSFT could potentially attempt another move higher, with the recent highs and the green resistance level around 55,144 providing areas to watch. On the other hand, a decisive break below support could increase the likelihood of further downside towards the longer-term moving average around 51,394.
With earnings due on Wednesday, the market's reaction to Microsoft's results may ultimately prove more influential than the current technical signals. A positive response could support a continuation of the recovery, while disappointing results or cautious guidance could put the existing structure under pressure.
For now, the key question is whether Microsoft can maintain support during this period of consolidation and attract renewed buying interest following its earnings release. The coming sessions may provide greater clarity on whether the current pause develops into another upward move or a deeper retracement.
Disclaimer
This analysis is for informational purposes only and should not be considered financial advice. Investors and traders should conduct their own research and consider individual risk tolerance before making any investment decisions.

Tradable assets:
Min.Deposit:
Max Leverage:
FCA:

Rating:
 Earnings Calendar
 Economic Calendar
 VAT Calculator
 Tax Free Childcare Calculator
 Percentage Calculator
 Compound Interest Calculator
 Loan Overpayment Calculator
 Mortgage Calculator
 Credit Card Calculator

 Investing
 Economics
 Trading
 Technical Analysis
 Personal Finance
 Calculator