Analysis
The Budget So Boring, Markets Loved It
$107
29 Oct 2026, 17:07
Neutral


Join Minipip Academy and access free courses in investing, trading, economics, and more.
Sign Up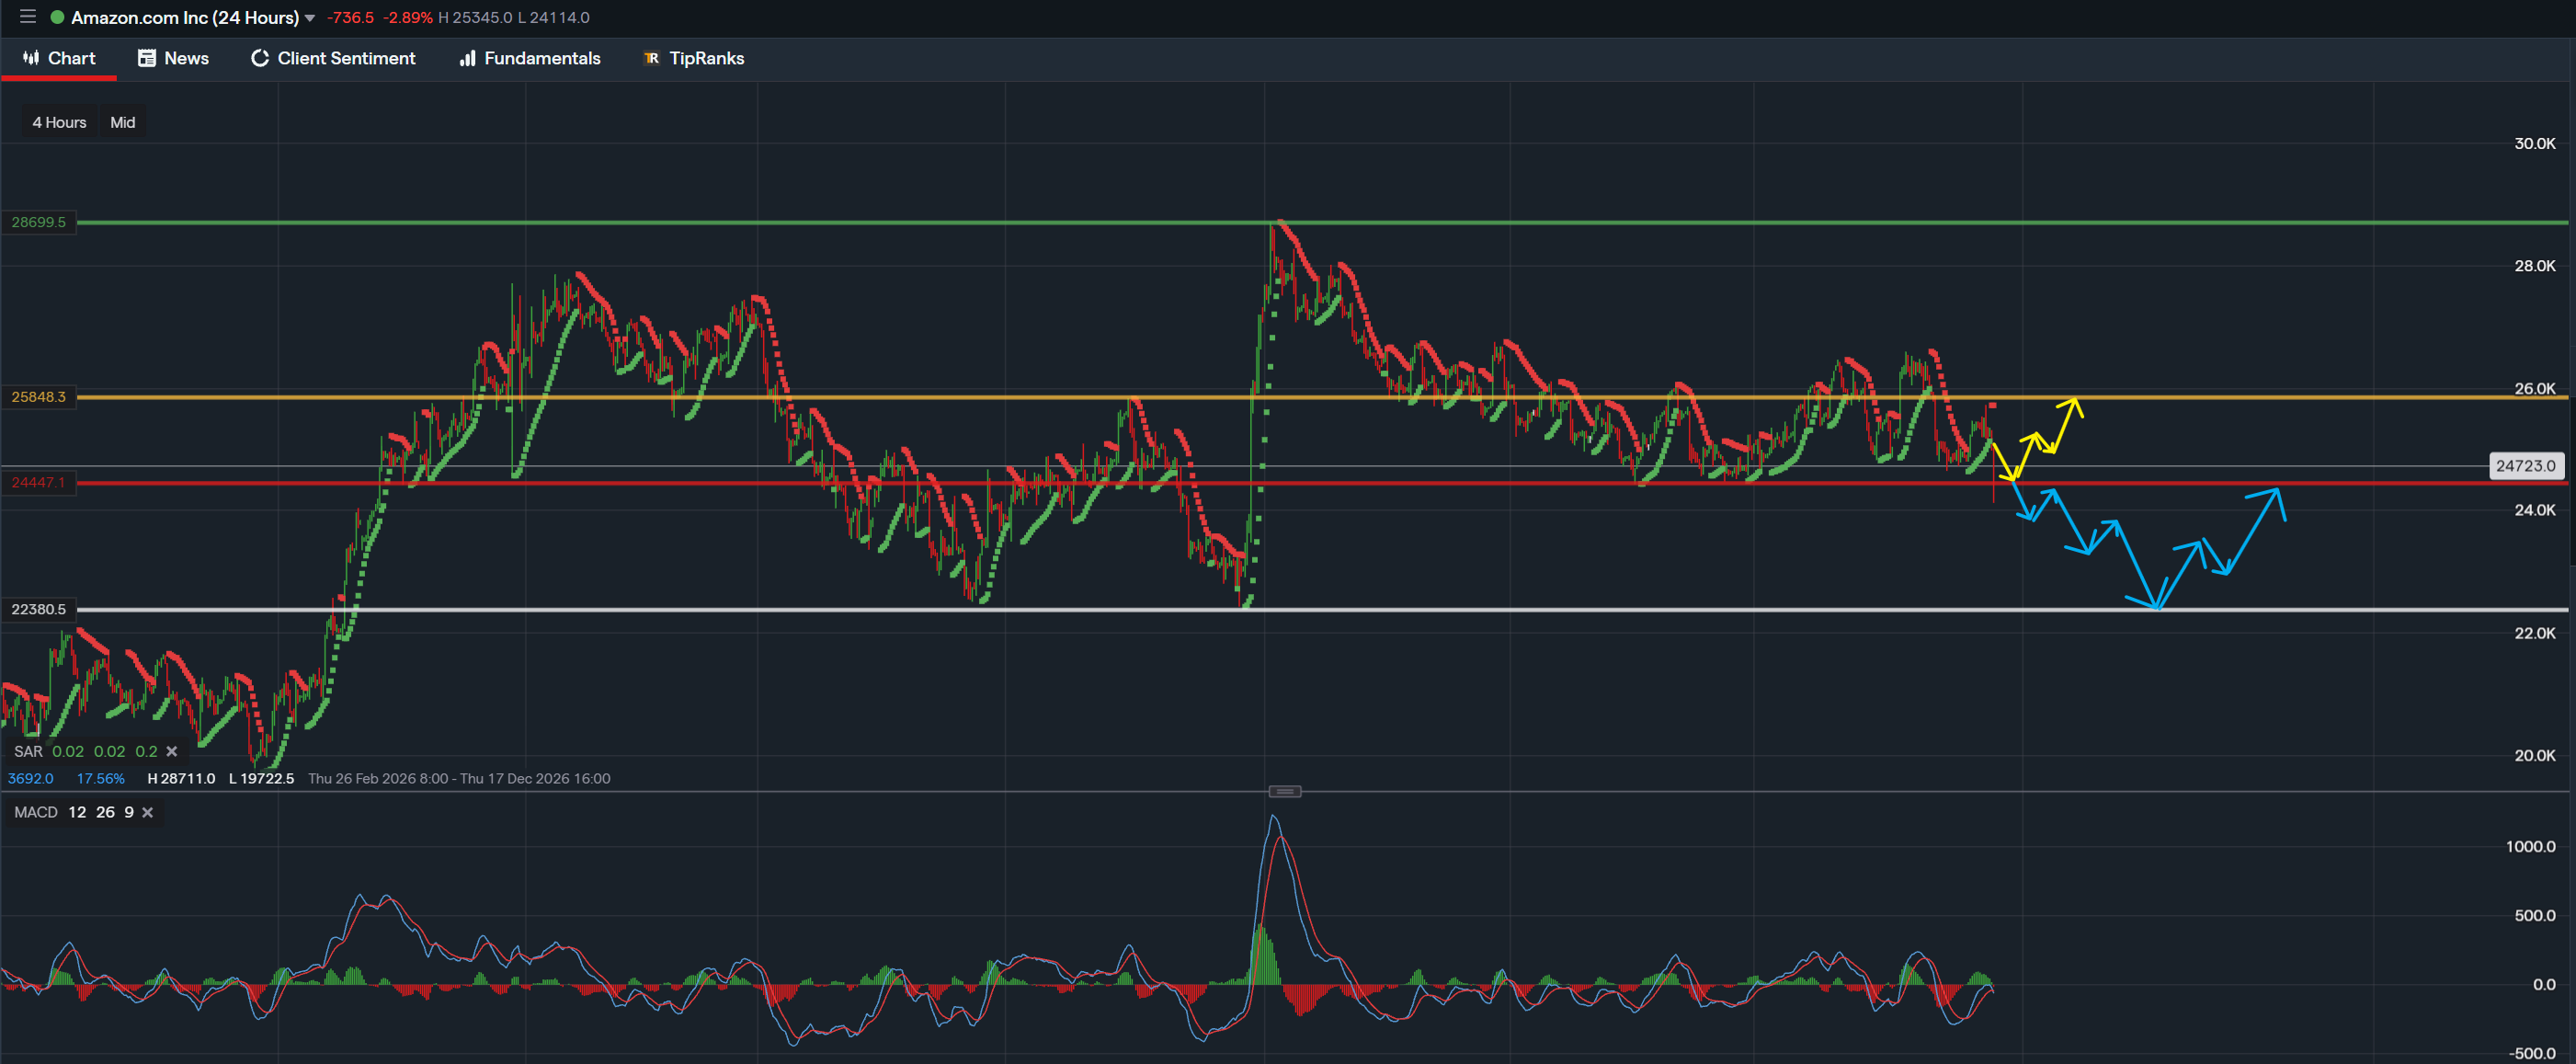
IG Data - Timeframe - 4H


Amazon (NASDAQ: AMZN) is approaching a potentially important trading session as investors prepare for the company's third-quarter earnings report, due to be released this evening, 29 October 2026. With the share price showing signs of consolidation on the four-hour (4H) chart, traders will be watching closely to see whether the upcoming results provide the momentum needed to break through resistance or trigger a further decline towards lower support levels.
Analysts are forecasting earnings per share (EPS) of approximately $2.01, compared with $1.95 for the same quarter last year, based on the estimates provided. However, earnings forecasts can vary between financial data providers, so investors should verify the latest consensus figures before the announcement.
The earnings report is particularly important because Amazon's performance is influenced by more than its online retail business. Amazon Web Services (AWS), advertising revenue, operating margins and investment in artificial intelligence infrastructure are also key areas investors will be monitoring. The market's reaction will depend not only on whether Amazon beats expectations, but also on its future outlook and what management communicates about growth and spending.
The Current Picture
Looking at the four-hour timeframe, Amazon's share price is showing a gradual decline followed by a period of consolidation. Rather than establishing a clear upward or downward trend in the most recent price action, the stock is moving within a relatively defined range, with buyers and sellers competing around the nearby support and resistance zones.
The horizontal lines drawn on the chart help identify price levels where the market has previously encountered buying or selling pressure. These levels become particularly important ahead of an earnings announcement, when increased volatility can push the share price beyond its existing trading range.
On the supplied chart, the displayed price is approximately 24,723, sitting between the red level around 24,447 and the yellow resistance zone near 25,848. Above these levels, the green line around 28,700 marks a previous major high, while the white horizontal line around 22,381 represents an important lower support area.
These figures refer to the price scale displayed on the supplied chart and should be checked against the instrument's actual quoted price before being used for trading decisions.
Key Levels to Watch
The red horizontal line around 24,447 is the first important level to monitor. With the share price trading relatively close to this area, a sustained move below it could indicate that sellers are gaining further control. If the breakdown is confirmed, the market may begin looking towards the lower white support zone around 22,381.
A move towards this lower level would represent a further bearish development, although support is not guaranteed to hold. Traders may watch how the price behaves as it approaches this area, looking for evidence of buying interest, a reversal pattern or improving momentum before assessing whether a recovery is developing.
For longer-term investors, a decline towards support may attract attention, but a lower share price alone does not establish that an attractive entry point has formed. The price reaction, wider market conditions and Amazon's earnings outlook would all remain relevant.
On the upside, the yellow resistance zone around 25,848 is the first significant barrier for buyers. If the share price remains supported above the red level and moves towards this yellow zone, the market will need to demonstrate sufficient buying pressure to break through it.
A convincing breakout above yellow resistance could open the door to a potential move towards the previous major high around 28,700. However, the path towards that level may not be straightforward, as the price could encounter renewed selling pressure along the way.
One development traders may watch for is a breakout followed by a retest. This occurs when the price moves above resistance, returns to test the same area and subsequently finds buying support. If the former resistance begins acting as support, it can strengthen the bullish technical picture. Nevertheless, a successful retest is not guaranteed, particularly during an earnings-driven move.
The Bullish Scenario
A bullish scenario could develop if Amazon delivers results that exceed market expectations or provides a stronger outlook for its major business segments. Positive commentary around AWS growth, artificial intelligence demand, advertising revenue or future profitability could help improve market sentiment.
From a technical perspective, buyers would first need to defend the red support area around 24,447 and generate enough momentum to challenge the yellow resistance zone near 25,848.
A sustained break above yellow resistance, ideally supported by strong price action and a successful retest, could indicate that bullish momentum is strengthening. In that situation, the previous high around 28,700 would become a potential area of interest for traders monitoring further upside.
However, even an earnings beat does not automatically guarantee a rising share price. If investors have already anticipated strong results, the market could react negatively if the figures or forward guidance fail to exceed expectations sufficiently. This is why the actual earnings figures, management commentary and price reaction should be considered together.
The Bearish Scenario
The bearish scenario becomes more relevant if Amazon's share price breaks below the red support area around 24,447 and struggles to recover above it.
Such a move would suggest that sellers are gaining the upper hand in the short term. If selling pressure continues, the white support level around 22,381 could become the next significant area to monitor.
The current technical indicators provide additional reasons to watch for possible downside pressure. However, neither can confirm that a substantial decline will necessarily follow, particularly while the share price remains within its current trading range.
A negative earnings surprise, weaker than expected AWS growth or disappointing guidance could add pressure to the share price. Equally, Amazon could report solid results and still experience a decline if investors become concerned about spending, profit margins or the amount of future growth already reflected in the share price.
For that reason, traders should distinguish between a temporary movement below support and a more convincing breakdown. A sustained move below the red level, followed by an unsuccessful attempt to reclaim it, would provide stronger evidence of continued selling pressure than a brief move beneath the line.
Momentum Signals: MACD and Parabolic SAR
The Parabolic SAR and Moving Average Convergence Divergence (MACD) indicators offer additional insight into Amazon's current momentum, and both suggest that traders should remain cautious in the short term.
The Parabolic SAR is a trend following indicator that displays dots above or below the price candles. When the dots appear above the price, as shown by the recent red markings on the chart, this is generally interpreted as a bearish signal, suggesting that sellers are currently exerting greater pressure. If the dots move below the price, it may indicate that momentum is shifting towards buyers.
The MACD provides a complementary view by comparing moving averages to help identify changes in momentum. On the supplied 4H chart, the MACD line appears close to crossing below its signal line. If this bearish crossover is confirmed, it could indicate that downward momentum is strengthening and that the share price may remain under pressure in the near term.
When considered together, these indicators suggest that the current market structure is not yet showing a convincing bullish reversal. However, neither indicator should be treated as a standalone signal to sell. Both can produce false signals during periods of consolidation, particularly when the price moves sideways without establishing a clear trend.
The bearish picture would become more convincing if the MACD confirms its downward crossover while the Parabolic SAR remains above the price and Amazon breaks below the red support zone around 24,447. This combination would provide additional evidence that selling pressure is strengthening.
Conversely, if the share price breaks above yellow resistance, the Parabolic SAR shifts below the candles and the MACD turns upwards, the technical picture could begin to improve. Traders will therefore be watching for confirmation across price action and both indicators rather than relying on a single signal.
Analyst Sentiment Remains Positive
Despite the short term technical weakness, analyst sentiment towards Amazon remains broadly positive. Based on the figures provided, TipRanks shows a Strong Buy consensus with a rating of 44 analysts, suggesting that many analysts remain optimistic about the company's longer-term prospects.
Amazon's position across e-commerce, cloud computing and digital advertising provides several potential sources of growth. Its continued investment in artificial intelligence could also support future opportunities, although the financial benefits will depend on demand, execution and the costs involved.
However, analyst sentiment should be considered separately from short-term technical signals. A stock can retain a positive longer-term analyst consensus while experiencing selling pressure, particularly ahead of a major earnings announcement.
For investors considering Amazon over a longer period, it is important to distinguish between the company's underlying business performance and its immediate price behaviour. Positive analyst ratings do not eliminate the possibility of further declines, and a bullish technical breakout would not, by itself, establish that the stock represents good value.
What Could Move the Price?
The earnings report could be the catalyst that determines whether Amazon breaks out of its current consolidation or continues to decline. Traders and investors will be assessing the headline EPS figure, revenue growth, AWS performance, operating profitability and management's expectations for the coming quarter.
A stronger than expected report could encourage buyers to return, potentially supporting a move towards the yellow resistance zone. If that level is broken convincingly, the previous high around 28,700 could become a potential area of interest.
On the other hand, disappointing results or cautious forward guidance could increase selling pressure and bring the red support zone into focus. A confirmed break below this level could expose the lower white support area.
It is also worth remembering that the market does not always react in the direction investors expect. Even strong earnings can lead to a decline if expectations were already high, while disappointing headline figures may be followed by a recovery if other parts of the report prove more encouraging.
The key will be how the market responds to the information released this evening and whether that reaction is supported by a clear technical breakout or breakdown.
Conclusion
Amazon is approaching its Q3 2026 earnings announcement with a mixed technical picture. The share price is consolidating near an important support area, the Parabolic SAR suggests that sellers currently have the advantage, and the MACD is approaching a possible bearish crossover.
A confirmed breakdown below the red support zone around 24,447 could bring the white support area near 22,381 into focus. Alternatively, a sustained move above the yellow resistance zone around 25,848 could improve the short term outlook and put the previous high near 28,700 back on the radar.
Ultimately, the earnings report could determine whether Amazon establishes a stronger recovery or extends its recent decline. The company's results, forward guidance and the market's reaction will all play a role in shaping the next move.
For beginner traders and investors, the most important takeaway is to avoid assuming that the earnings announcement will automatically push the share price in either direction. Monitoring established support and resistance levels, while using the MACD and Parabolic SAR as supporting indicators, may provide a clearer understanding of the market's developing direction.
Disclaimer
This analysis is for informational purposes only and should not be considered financial advice. Investors and traders should conduct their own research and consider individual risk tolerance before making any investment decisions.

Tradable assets:
Min.Deposit:
Max Leverage:
FCA:

Rating:
 Earnings Calendar
 Economic Calendar
 VAT Calculator
 Tax Free Childcare Calculator
 Percentage Calculator
 Compound Interest Calculator
 Loan Overpayment Calculator
 Mortgage Calculator
 Credit Card Calculator

 Investing
 Economics
 Trading
 Technical Analysis
 Personal Finance
 Calculator