Analysis
Meta Platforms (META) Stock Analysis: Earnings Outlook and Daily Technical Overview
$694.25
21 Oct 2026, 12:19
Neutral


Join Minipip Academy and access free courses in investing, trading, economics, and more.
Sign Up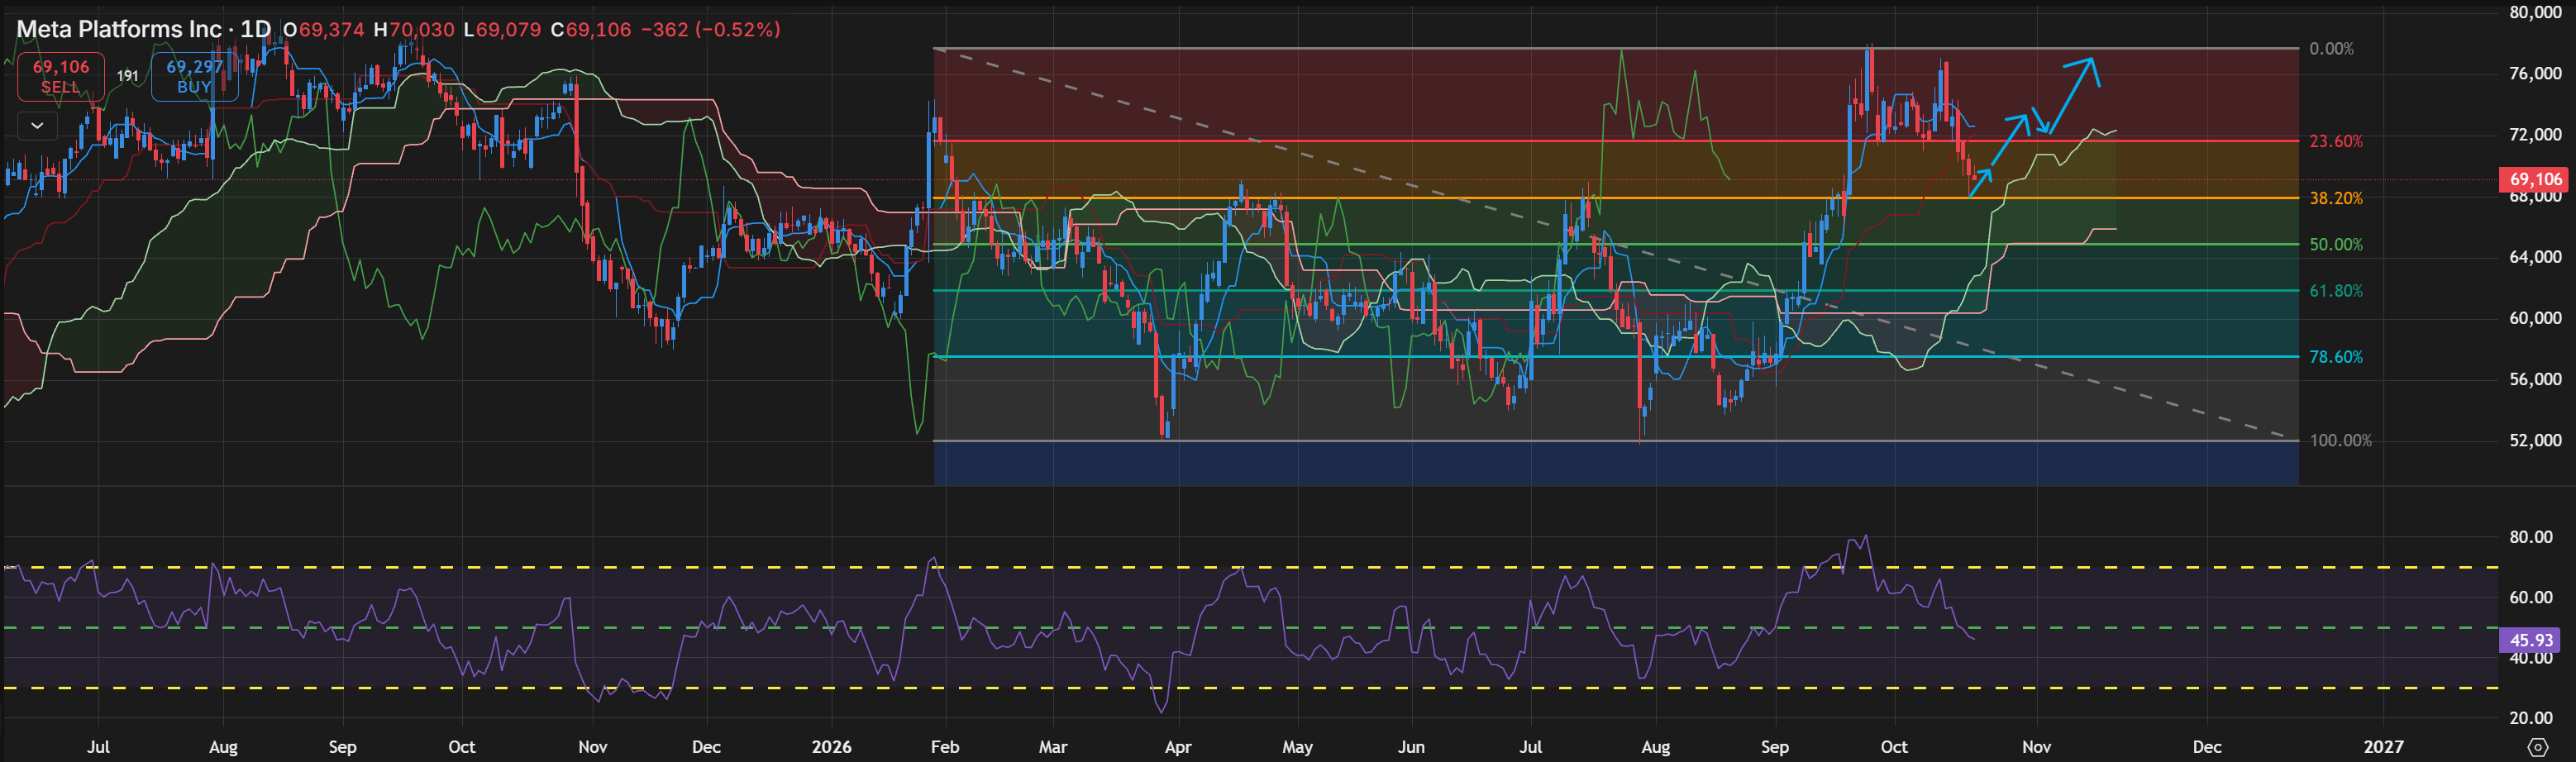
Capital Data - Timeframe - 1D


Meta Platforms (NASDAQ: META) is approaching a key point on the daily chart, with its latest earnings report expected to influence short term market sentiment. Forecasted earnings per share (EPS) have declined from $7.25 to $6.54 for the quarter, raising questions about how the company's latest performance and forward guidance could affect its share price. With META shares pulling back from recent highs, the Ichimoku Cloud, Relative Strength Index (RSI) and key price levels provide useful context for assessing the stock's current technical structure and potential future movements.
Meta Platforms Stock Price and Market Structure
Meta Platforms has experienced a significant recovery from previous lows around 520–550, advancing towards the 760–780 region before encountering selling pressure. Since reaching these highs, the share price has retraced towards $691, suggesting that bullish momentum has weakened following the earlier rally. This movement places the stock between the $680 and $720 regions, which are important areas to monitor as the daily chart develops.
The recent pullback does not necessarily indicate a complete reversal of the broader recovery. However, the inability to maintain the previous highs suggests that buyers may need to regain momentum before another sustained advance can develop. Whether the price stabilises around current levels or continues lower may depend on the interaction between technical support, market sentiment and the company's upcoming earnings results.
Ichimoku Cloud Analysis for META Stock
The Ichimoku Cloud is a useful technical indicator for assessing trend direction, momentum and potential support and resistance. On Meta's daily chart, the recent decline highlights a loss of short-term bullish momentum following the strong advance towards the 760–780 region.
The cloud provides a reference for evaluating whether the broader recovery remains intact as the share price retraces. If META shares recover above $720 and maintain upward momentum, the previous highs could become a potential area of renewed interest. A move in this direction, supported by improving price action relative to the Ichimoku Cloud, would suggest that buyers are regaining some control.
Alternatively, a sustained decline below $680 could indicate further weakness in the daily technical structure. In that scenario, the $650 region could become a potential area of support, with $620 representing a further downside level if selling pressure continues. These levels are reference points for technical analysis rather than guaranteed price targets, and the evolving cloud structure may change as new daily candles form.
META Stock RSI Analysis
The Relative Strength Index (RSI) is currently reading 45.93, placing it below the neutral 50 level. This suggests that upward momentum has weakened and that selling pressure has become more prominent compared with the earlier stages of the rally. However, the RSI remains above the traditional oversold threshold of 30, meaning the indicator does not currently show deeply oversold conditions.
The decline in RSI from above 70 during the recent advance towards the October highs highlights the reduction in bullish momentum. This is consistent with the price retracement visible on the daily chart, where Meta has struggled to maintain its previous upward trajectory.
If the RSI moves back above 50 alongside a recovery in the share price, it could indicate improving momentum and provide additional context for a potential move towards $720. Conversely, a continued decline in RSI alongside a break below $680 could reinforce the view that selling pressure is increasing. The RSI is most informative when assessed alongside price action and the Ichimoku Cloud rather than used in isolation.
Meta Platforms Earnings and Potential Stock Price Reaction
Meta's earnings announcement introduces additional uncertainty into the current technical outlook. Forecasted EPS has declined from $7.25 to $6.54 for the quarter, but the share price reaction will depend on how the reported figures compare with market expectations. Revenue growth, advertising performance, operating expenses and the company's investment in artificial intelligence could also influence sentiment.
A stronger-than-expected earnings report or positive forward guidance could support a recovery in META shares, potentially bringing the $720 region back into focus. If buying momentum improves, the previous highs around 760–780 could become relevant again. However, disappointing results, weaker guidance or concerns about rising expenditure could contribute to further selling pressure.
It is also important to recognise that a decline in forecasted EPS does not automatically mean the share price will fall. Markets respond to expectations as well as reported results, meaning that even weaker year-on-year earnings could be received positively if they exceed what investors had anticipated. Equally, apparently strong results may fail to support the share price if the outlook disappoints.
META Technical Analysis: Key Levels to Watch
The $680 region is an important level within the current daily structure. If the price holds above this area and subsequently recovers towards $720, it could suggest that the recent pullback is beginning to stabilise. A sustained move above $720 would provide further evidence of improving price momentum, although a retest of previous highs would remain uncertain.
On the downside, a confirmed break below $680 could expose the $650 region, followed by $620 if the decline extends further. The significance of these levels will depend on how the price behaves around them, alongside changes in RSI momentum and the Ichimoku Cloud.
With earnings approaching, volatility may increase and the stock could move rapidly through several technical levels. As a result, the daily closing price following the announcement may provide a clearer picture of the developing structure than short-lived price movements immediately surrounding the release.
Conclusion: Meta Platforms Daily Technical Outlook
Meta Platforms' daily technical analysis shows that bullish momentum has weakened following the rejection from the 760–780 region. The current RSI reading of 45.93 reflects this loss of momentum, while the Ichimoku Cloud provides additional context for assessing the strength of the broader price structure.
The $680 and $720 regions remain important reference points for monitoring the next potential move. A recovery above $720 could indicate improving momentum and bring previous highs back into focus, whereas a sustained decline below $680 could expose lower support areas around $650 and $620.
Ultimately, Meta's earnings results and forward guidance may play a significant role in determining how the technical picture develops. Whether the current pullback proves temporary or develops into a more extended correction remains uncertain. Monitoring price action alongside the Ichimoku Cloud and RSI can help provide context as new market information becomes available.
Disclaimer
This analysis is for informational purposes only and should not be considered financial advice. Investors and traders should conduct their own research and consider individual risk tolerance before making any investment decisions

Tradable assets:
Min.Deposit:
Max Leverage:
FCA:

Rating:
 Earnings Calendar
 Economic Calendar
 VAT Calculator
 Tax Free Childcare Calculator
 Percentage Calculator
 Compound Interest Calculator
 Loan Overpayment Calculator
 Mortgage Calculator
 Credit Card Calculator

 Investing
 Economics
 Trading
 Technical Analysis
 Personal Finance
 Calculator