Analysis
Shopify Stock Technical Analysis: SHOP Breakout Puts $181.79 in Focus
$160.11
06 Oct 2026, 12:52
Neutral


Join Minipip Academy and access free courses in investing, trading, economics, and more.
Sign Up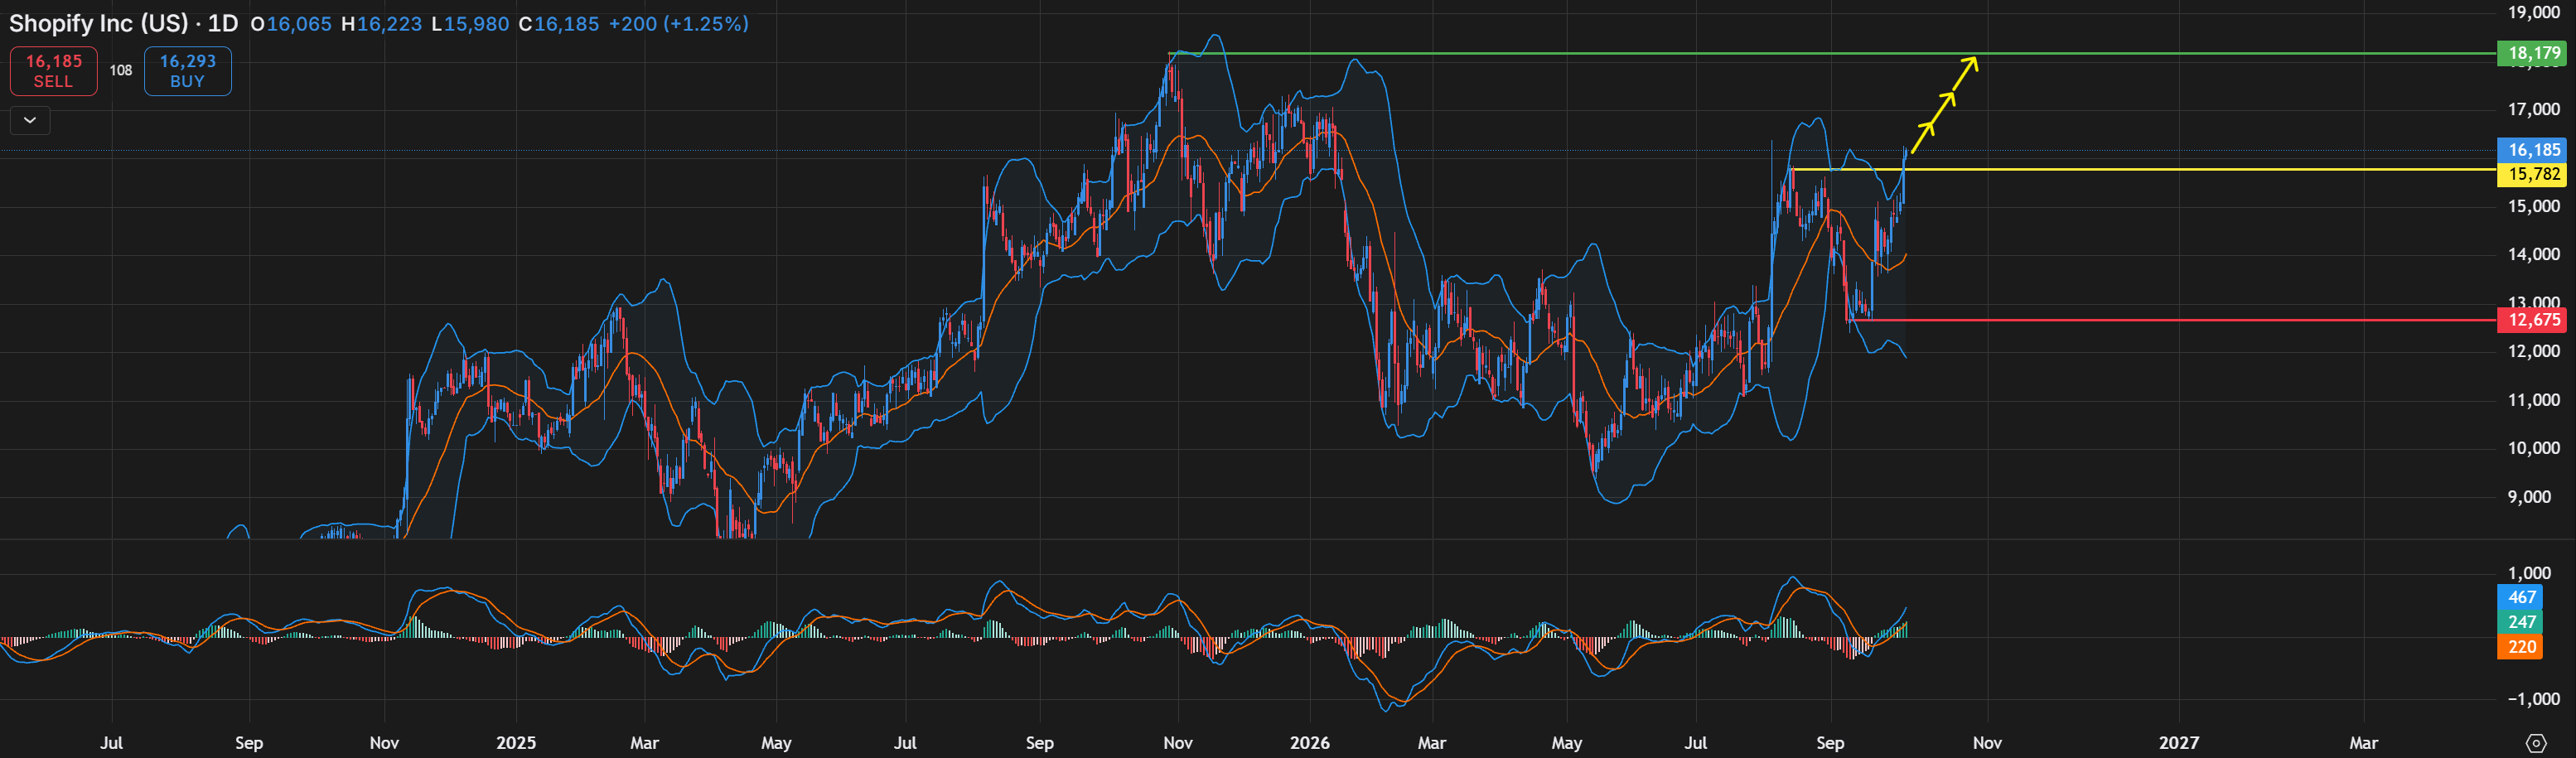
Capital Data - Timeframe - 1D


Shopify (SHOP) is showing a potentially bullish technical setup on the daily timeframe, with price breaking above the recent resistance area around $157.82. The stock is currently trading around $161.85, putting the next major resistance area near $181.79 into focus as a potential upside target.
The recent move higher comes after Shopify found support around $126.75 and subsequently recovered towards the upper end of its recent trading range. If the breakout above $157.82 is sustained, it could potentially provide the stock with further room to the upside.
Shopify Stock Breakout Above $157.82
The $157.82 level is currently an important area to monitor. Price has recently moved above this resistance, which could indicate an improvement in short-term momentum.
If Shopify manages to remain above this level, the previous resistance could potentially become a new area of support. From there, continued buying pressure could potentially bring the $181.79 region into focus.
However, this remains a potential scenario rather than a confirmed move. A failure to hold above $157.82 could weaken the current breakout and potentially result in Shopify moving back towards lower support levels.
Shopify Bollinger Bands Show Expanding Volatility
The Bollinger Bands are also providing an interesting technical signal. The bands had previously contracted, creating a period of relatively subdued volatility before beginning to expand as Shopify moved higher.
This expansion can indicate that volatility is increasing and that a stronger price movement may be developing. In Shopify's case, the expansion is currently occurring alongside an upward move, which could potentially support further bullish momentum if the breakout continues.
Price is also trading towards the upper portion of the Bollinger Bands, highlighting the strength of the recent move. Nevertheless, traders would need to monitor whether price can maintain this momentum or whether the move eventually begins to lose strength.
Shopify MACD Signals Potential Bullish Momentum
The MACD is adding further technical confirmation to the current setup. On the daily chart, the MACD has crossed above its signal line, indicating that momentum has potentially shifted towards the upside.
The positive movement in the MACD also coincides with the recent price breakout, making the combination worth monitoring. If the MACD continues to remain above its signal line and momentum continues to strengthen, Shopify could potentially have further room to advance.
Conversely, a future crossover back below the signal line could indicate that bullish momentum is beginning to weaken.
Shopify Stock Analyst Outlook and Valuation
The broader analyst outlook is another factor worth considering. Based on the figures provided, TipRanks currently shows a Strong Buy consensus from 32 analysts, which indicates a broadly positive analyst outlook.
Shopify's valuation is also an important consideration. The stock's forward P/E of approximately 65.74 is below its current P/E of approximately 109.82. This difference can suggest that analysts are expecting earnings to increase, which could potentially result in a lower earnings multiple if those expectations are achieved.
However, Shopify's valuation remains relatively high, meaning the market may already be pricing in substantial future growth. As a result, the stock could remain sensitive to earnings results, company guidance and changes in investor expectations.
Shopify Stock Forecast: $181.79 as a Potential Upside Target
From a technical perspective, $181.79 represents a potential upside area to watch if the current breakout continues.
For this scenario to remain technically constructive, Shopify would ideally need to maintain its position above the $157.82 breakout level. Continued strength above this area could potentially allow the stock to challenge higher resistance, with $181.79 becoming a possible target.
If Shopify instead falls back below $157.82 and the breakout fails, the bullish setup could weaken. In that scenario, traders may begin watching the lower support around $126.75 for signs of whether buyers are willing to step back into the market.
Shopify Technical Analysis: Key Levels and Momentum
Overall, Shopify is currently showing several technical factors that could potentially support further upside on the daily timeframe. The breakout above $157.82, expanding Bollinger Bands and bullish MACD crossover are all pointing towards improving momentum.
At the same time, the stock's relatively high valuation means that expectations for future growth appear significant. This makes the upcoming price action particularly important, as maintaining the breakout could strengthen the bullish technical structure, while a move back below resistance could undermine it.
For now, $157.82 remains an important level to monitor, while $181.79 represents a potential upside area if bullish momentum continues. Meanwhile, $126.75 remains an important lower support area should the current breakout lose momentum.
Disclaimer
This analysis is for informational purposes only and should not be considered financial advice. Investors and traders should conduct their own research and consider individual risk tolerance before making any investment decisions.

Tradable assets:
Min.Deposit:
Max Leverage:
FCA:

Rating:
 Earnings Calendar
  Economic Calendar
  VAT Calculator
  Tax Free Childcare Calculator
 Percentage Calculator
 Compound Interest Calculator
  Loan Overpayment Calculator
 Mortgage Calculator
 Credit Card Calculator
 Investing
  Economics
 Trading
  Technical Analysis
  Personal Finance
 Calculator