Visa (NYSE:) Technical Analysis: Earnings in Focus as Bullish Momentum Builds
$364.68
28 Jul 2026, 15:59
Neutral

Join Minipip Academy and access free courses in investing, trading, economics, and more.
Sign Up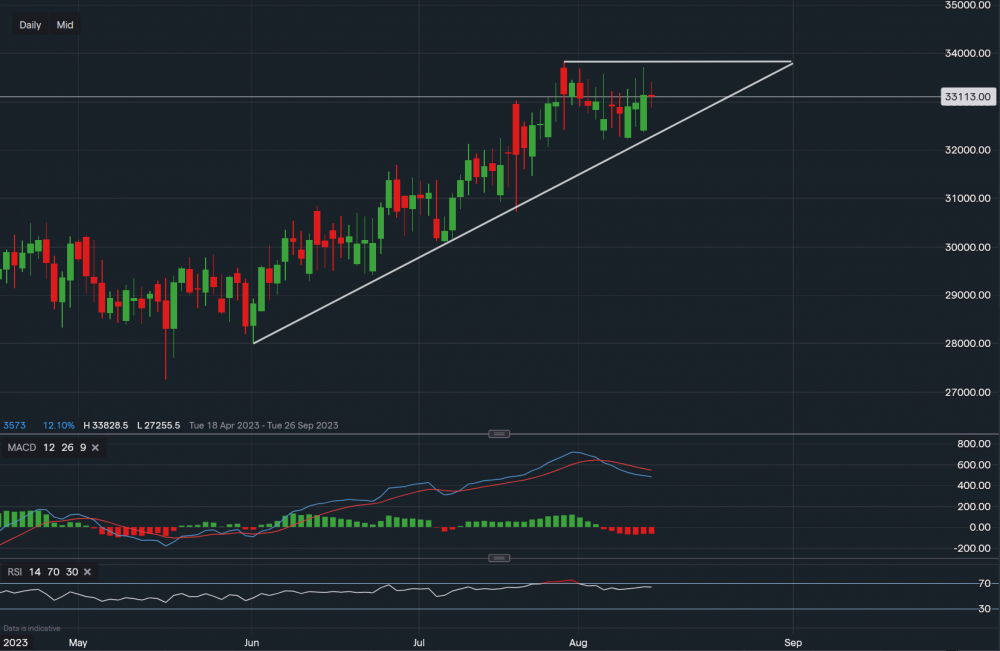
Chart & Data from IG
Taking a look at Home Depot as the earnings season is coming to an end. The retail giant is due to report earnings tomorrow, and currently, its stock is trading at around $331.13 a share. Looking at the chart on the daily timeframe, we can see that the stock remains in a bullish trend after its recent retracement. The price has set a new high so far in the quarter at $338.28, now it has retraced back to the supportive trendline (ascending). After a few days of consolidation, we now may see a push back up to the high, a break above the high could see the price rise higher towards the levels seen at the start of the year ($342-$346). Support sits at $326.27 then along the trendline at $323.50. A break below the trendline would not necessarily mean that a move lower is expected as there is also support at $322.12. A break below this point would be an indication of a move lower. Looking at the technical indicators, MACD is negative but RSI is strongly positive as it reads 63. So a mixed view prior to the earnings release.

Tradable assets:
Min.Deposit:
Max Leverage:
FCA:

Rating:
 Earnings Calendar
  Economic Calendar
  VAT Calculator
  Tax Free Childcare Calculator
 Percentage Calculator
 Compound Interest Calculator
  Loan Overpayment Calculator
 Mortgage Calculator
 Credit Card Calculator
 Investing
  Economics
 Trading
  Technical Analysis
  Personal Finance
 Calculator


