Visa (NYSE:) Technical Analysis: Earnings in Focus as Bullish Momentum Builds
$364.68
28 Jul 2026, 15:59
Neutral

Join Minipip Academy and access free courses in investing, trading, economics, and more.
Sign Up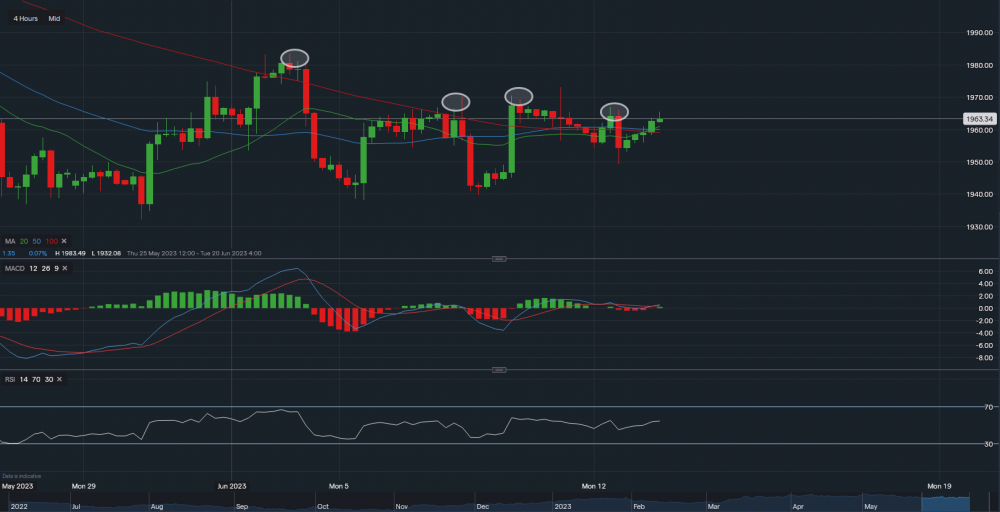
Chart & Data from IG
Based on the 4-hourly timeframe, Gold has climbed above the 100-day moving average once again. Currently trading at around $1,963 an ounce. We can see that it has attempted to break higher on 4 different occasions (ovals), the support sits along $1,959-$1,960. Which happens to be all 3 of the moving averages, A break and close below the averages could see the price slide lower again towards the support sitting at $1,949. Looking at the upside, resistance sits at $1,966 then at $1,970, and then the key resistance at $1,973. A break and close above $1,973 may see the price of gold climb higher with the target then of $1,983 an ounce. Indicators are slightly mixed at this moment in time, the MACD is flat-positive and the RSI neutral-positive as it reads 54.

Tradable assets:
Min.Deposit:
Max Leverage:
FCA:

Rating:
 Earnings Calendar
  Economic Calendar
  VAT Calculator
  Tax Free Childcare Calculator
 Percentage Calculator
 Compound Interest Calculator
  Loan Overpayment Calculator
 Mortgage Calculator
 Credit Card Calculator
 Investing
  Economics
 Trading
  Technical Analysis
  Personal Finance
 Calculator


