Visa (NYSE:) Technical Analysis: Earnings in Focus as Bullish Momentum Builds
$364.68
28 Jul 2026, 15:59
Neutral

Join Minipip Academy and access free courses in investing, trading, economics, and more.
Sign Up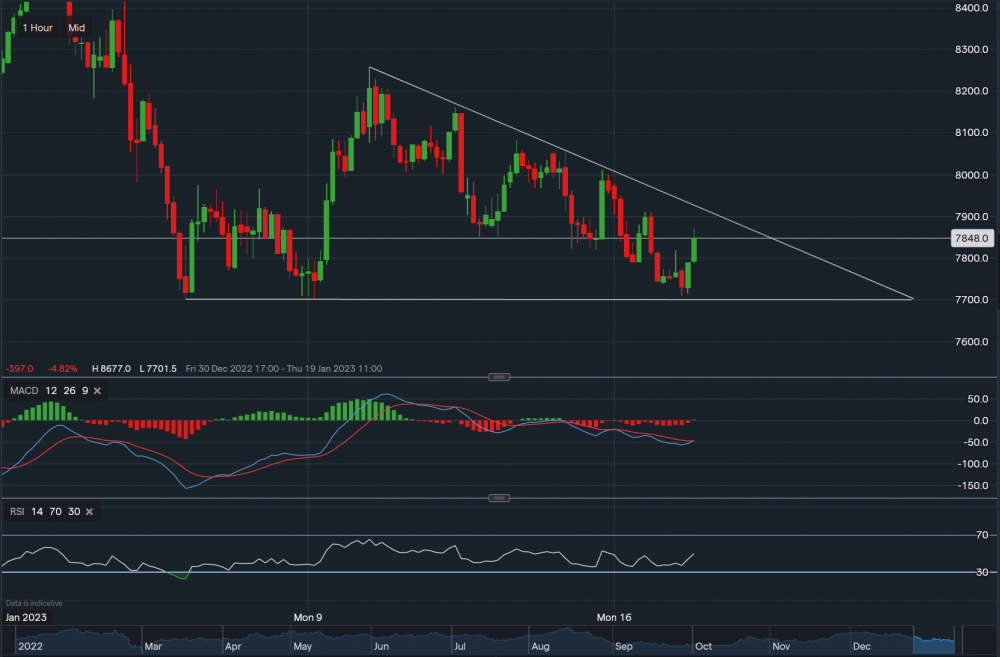
Carbon Emissions - 1 Hour
From a technical aspect, carbon is currently trading at around €78.48. Towards the upside, resistance sits at €78.75 then at €78.88 then at €79.11. A break above €79.11 could create a reversal trend following a bearish week last week. However, at the moment the bias remains bearish. As shown on the 1-hourly timeframe on the chart, carbon is forming a descending triangle. Therefore, support sits at €78.06 then at €77.89 then at €77.40. A dip below €77.40 may see the price of carbon drop towards the key support price level of €77.01. Looking at the technical indicators, MACD is starting to turn positive and RSI is neutral as it reads 50.
 Earnings Calendar
  Economic Calendar
  VAT Calculator
  Tax Free Childcare Calculator
 Percentage Calculator
 Compound Interest Calculator
  Loan Overpayment Calculator
 Mortgage Calculator
 Credit Card Calculator
 Investing
  Economics
 Trading
  Technical Analysis
  Personal Finance
 Calculator


