News
S&P 500 Hits Record High as Oil Prices and Treasury Yields Fall
06 Oct 2026, 15:23


Join Minipip Academy and access free courses in investing, trading, economics, and more.
Sign Up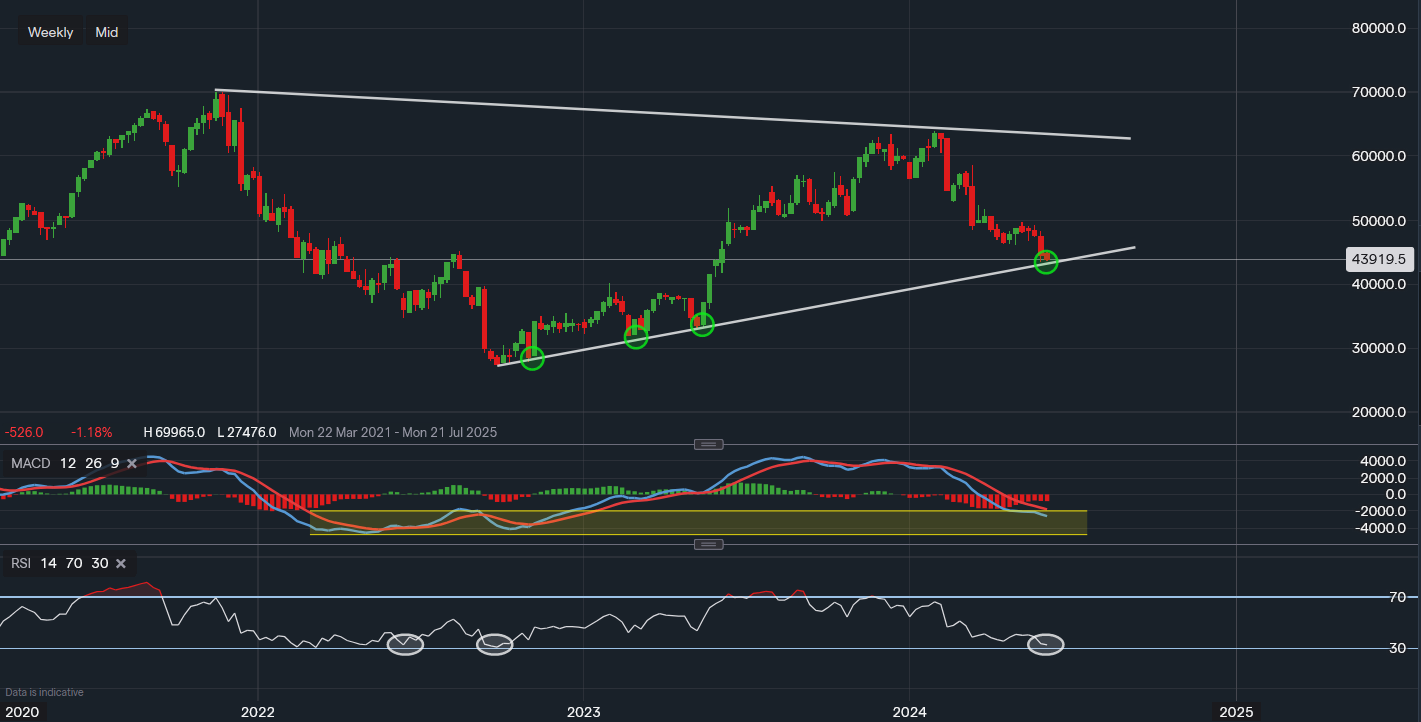
Chart & Data from IG


Taking a look at Adobe as it has approached its supportive trendline. This trendline has acted as a key point of support for the stock in the past, which is highlighted by the green ovals. Currently, the tech firm’s shares are trading at around $439.19 a share after selling off from nearly $639 across the last 4 months. Trendline support roughly reads $430 and a break below it could see this stock’s share price slide to around $400, closing the gap below of $410-$420. However, as the company is expected to report its earnings next Thursday (13th), this may act as a new catalyst for the short-mid term. Therefore, any consolidation along the trendline may prompt a bounce towards the upside. The resistance from current levels reads $451.12. A break above it would shift trader focus to $479.20 and then $496.67. Looking at the technical indicators on the weekly chart as the weekly timeframe provides more insight into the shorter-term price movement when compared with the monthly. The MACD is still negative but it has now entered the oversold territory based on the stock’s history. Additionally, the RSI has also neared the oversold territory as it reads 32. This level for the RSI was last seen at the very lows of the 2022 bear market. These technicals certainly offer an invitation for the buyers.

Tradable assets:
Min.Deposit:
Max Leverage:
FCA:

Rating:
 Earnings Calendar
  Economic Calendar
  VAT Calculator
  Tax Free Childcare Calculator
 Percentage Calculator
 Compound Interest Calculator
  Loan Overpayment Calculator
 Mortgage Calculator
 Credit Card Calculator
 Investing
  Economics
 Trading
  Technical Analysis
  Personal Finance
 Calculator