UnitedHealth Group Analysis: Defensive Healthcare Scale Amid Regulatory and Margin Pressures
$407.34
12 Jun 2026, 17:06
Neutral

Join Minipip Academy and access free courses in investing, trading, economics, and more.
Sign Up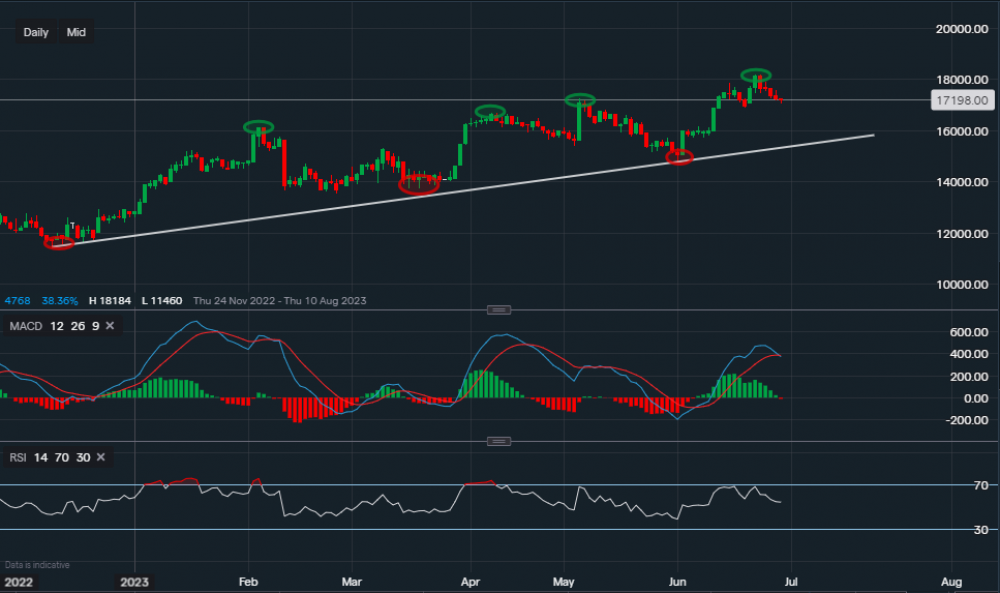
Chart & Data from IG
Taking a look at Adidas from a technical aspect as its stock has now been rallying since the start of the year. Looking at the daily timeframe, we can see the price has been creating higher highs and higher lows, suggesting the bias is bullish. The green ovals highlight the higher highs and the red ones highlight the lower lows. Currently, its stock is trading at around €171.98 a share, we can see that a new high was created on the 21st of June and the price has been retracing ever since. The next level of support sits at €168.95, a break and close below this level could see the price retrace lower to €162.48 and even the supportive trendline (€156.67). The support along the trendline is the key level, a break below could indicate that a reversal trend has occurred. Although, this is not guaranteed. As the bias remains bullish for the time being, resistance now sits at €172.45 then at €178.65 and then back again at €181.77. A rise and close above €181.77 may see the price climb higher with the target then around €190 a share. Over to the technical indicators, MACD has just turned negative and RSI faltering as it now reads 54. Even though the indicators are faltering, this retracement may only be short-term, and the mid-long term outlook remains bullish.

Tradable assets:
Min.Deposit:
Max Leverage:
FCA:

Rating:
 Earnings Calendar
  Economic Calendar
  VAT Calculator
  Tax Free Childcare Calculator
 Percentage Calculator
 Compound Interest Calculator
  Loan Overpayment Calculator
 Mortgage Calculator
 Credit Card Calculator
 Investing
  Economics
 Trading
  Technical Analysis
  Personal Finance
 Calculator


