Microsoft Share Price Analysis: Could Oversold RSI Signal a Recovery?
$379.41
29 Jun 2026, 10:01
Bullish

Join Minipip Academy and access free courses in investing, trading, economics, and more.
Sign Up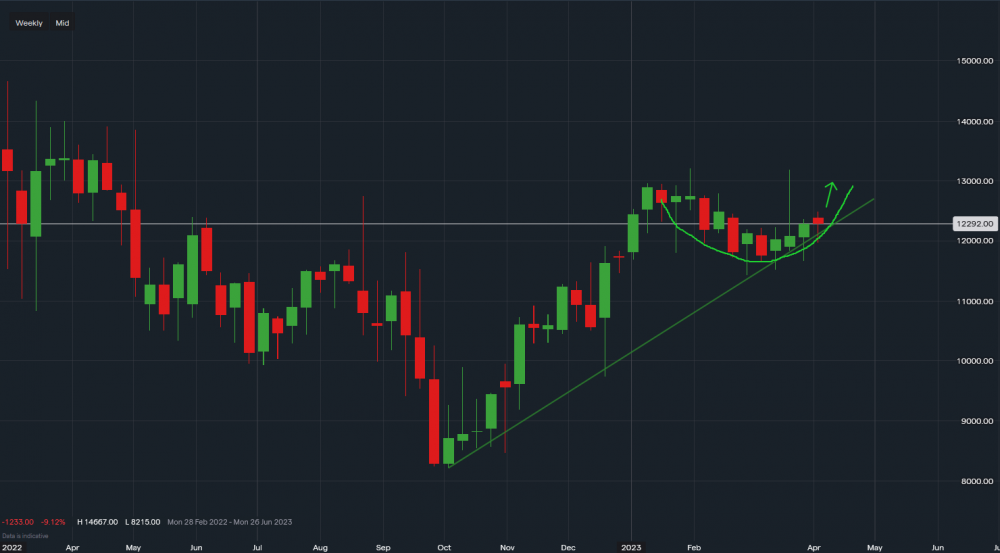
Nike - Chart & Data from IG
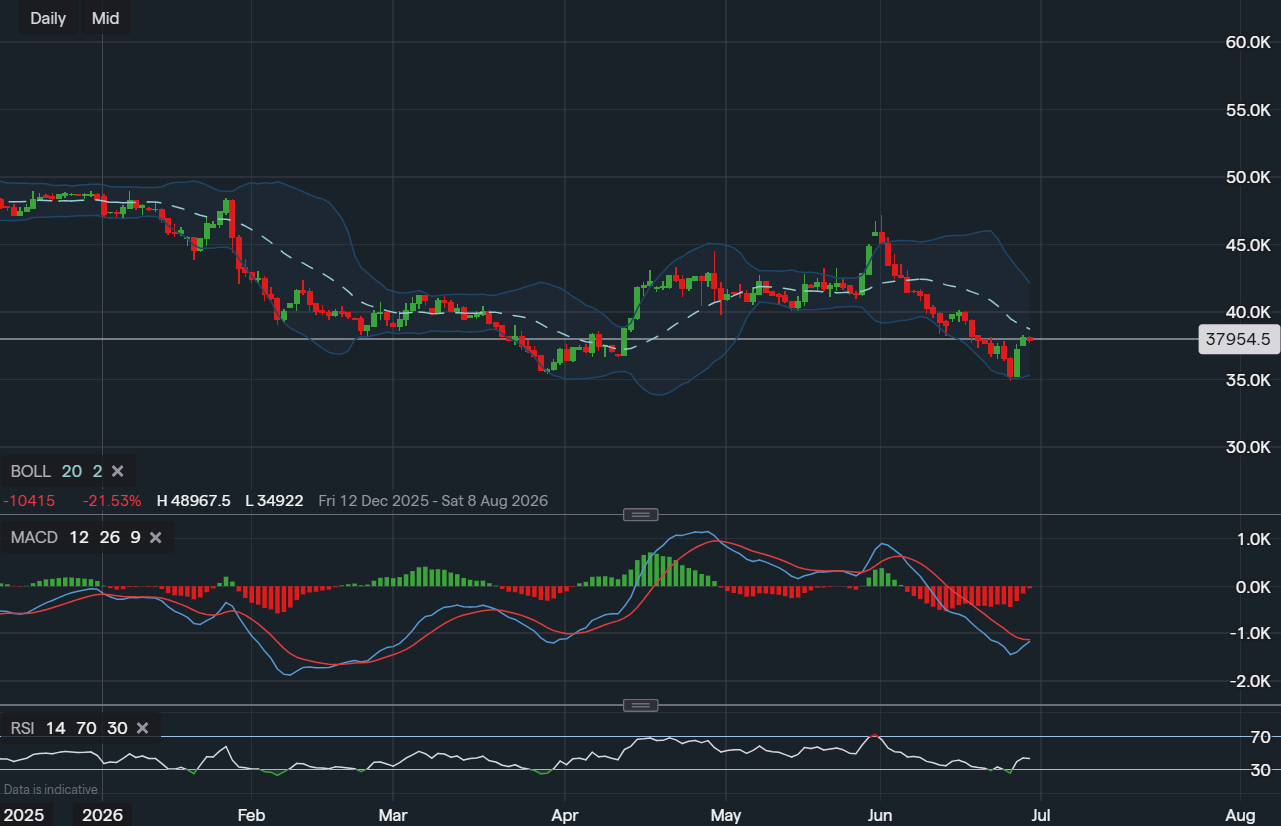
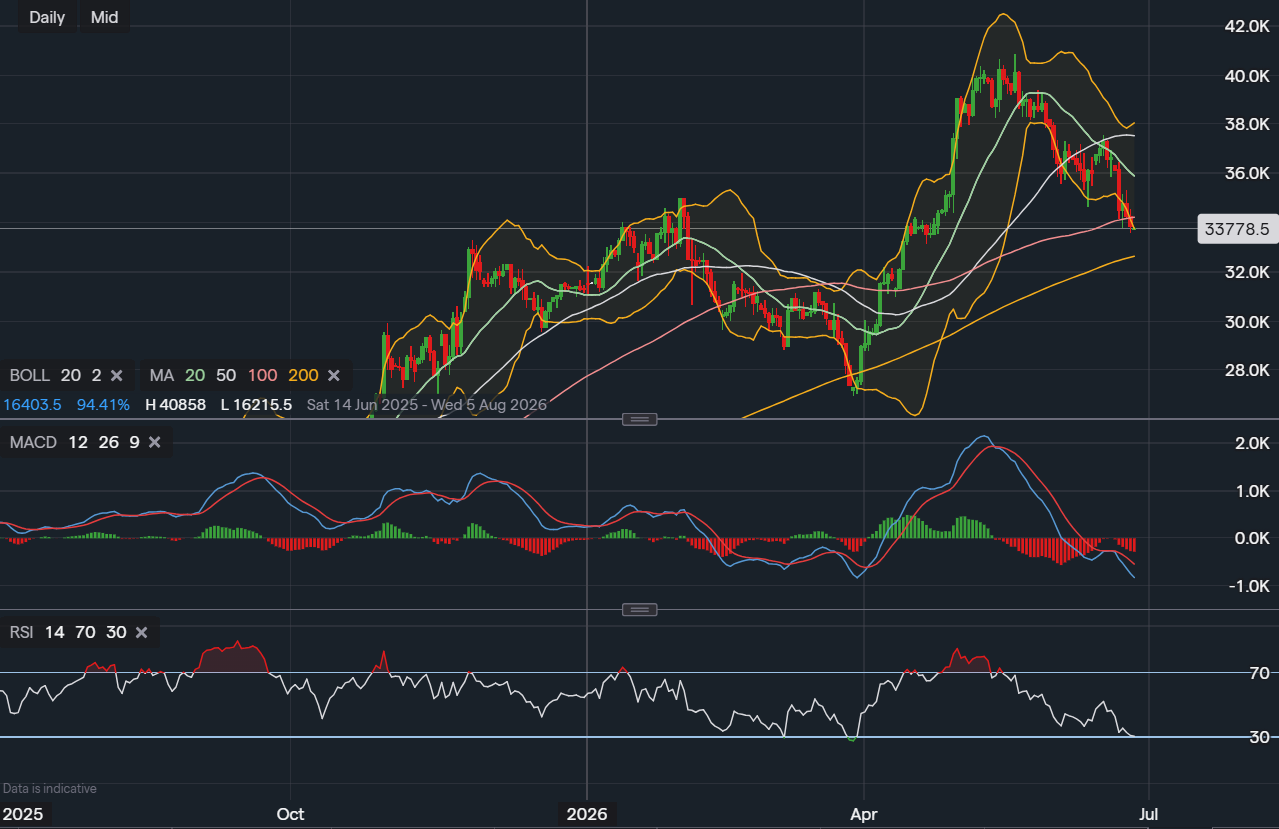
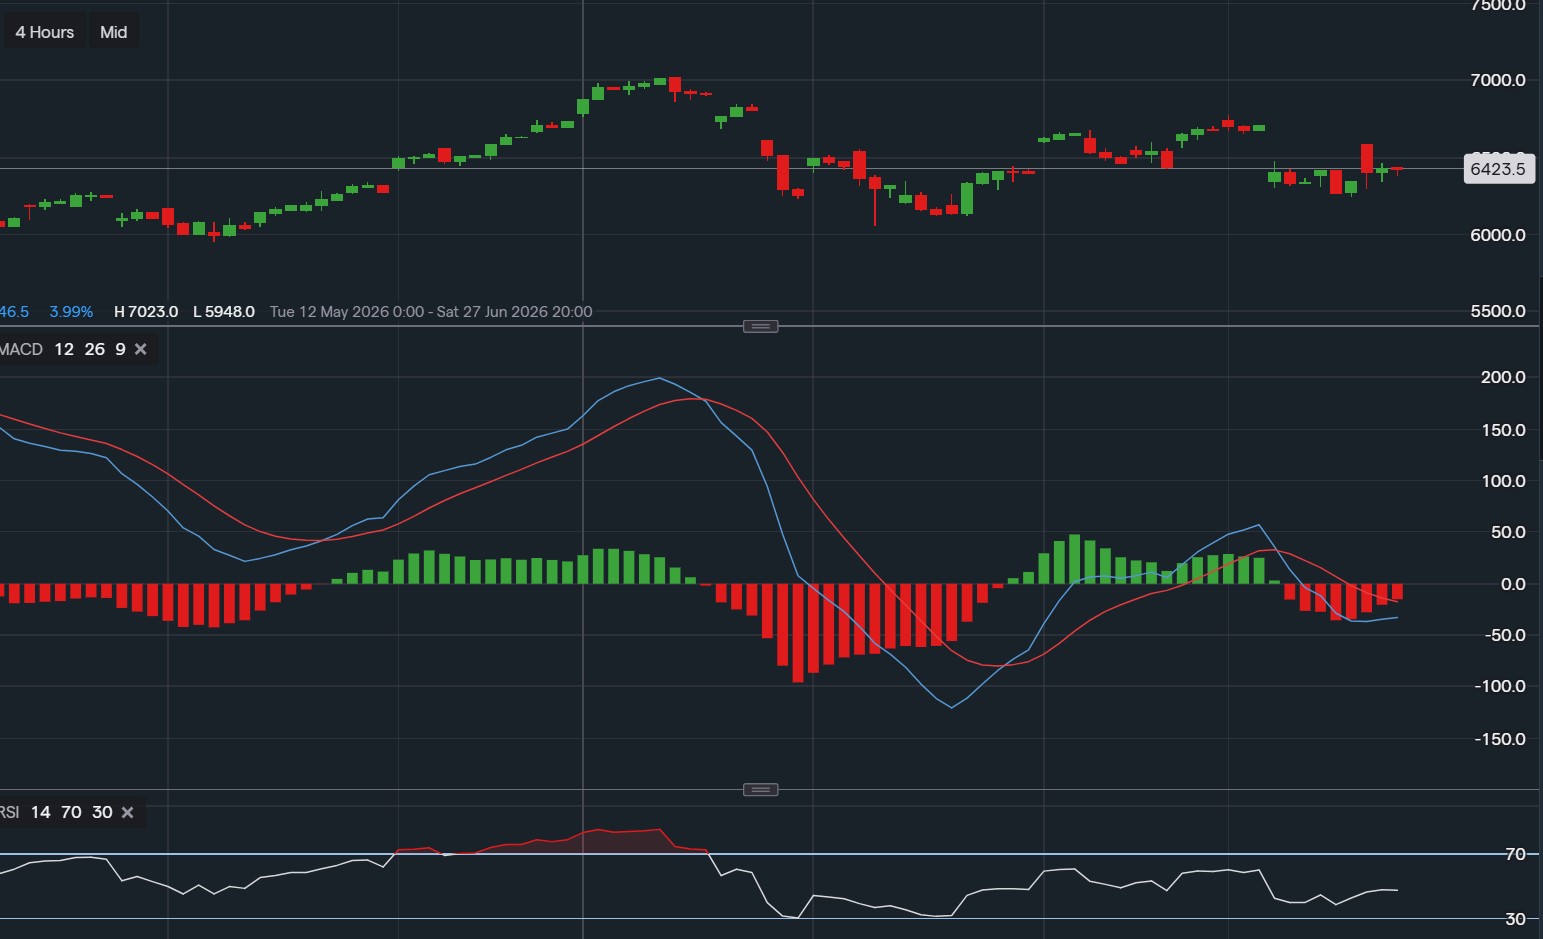
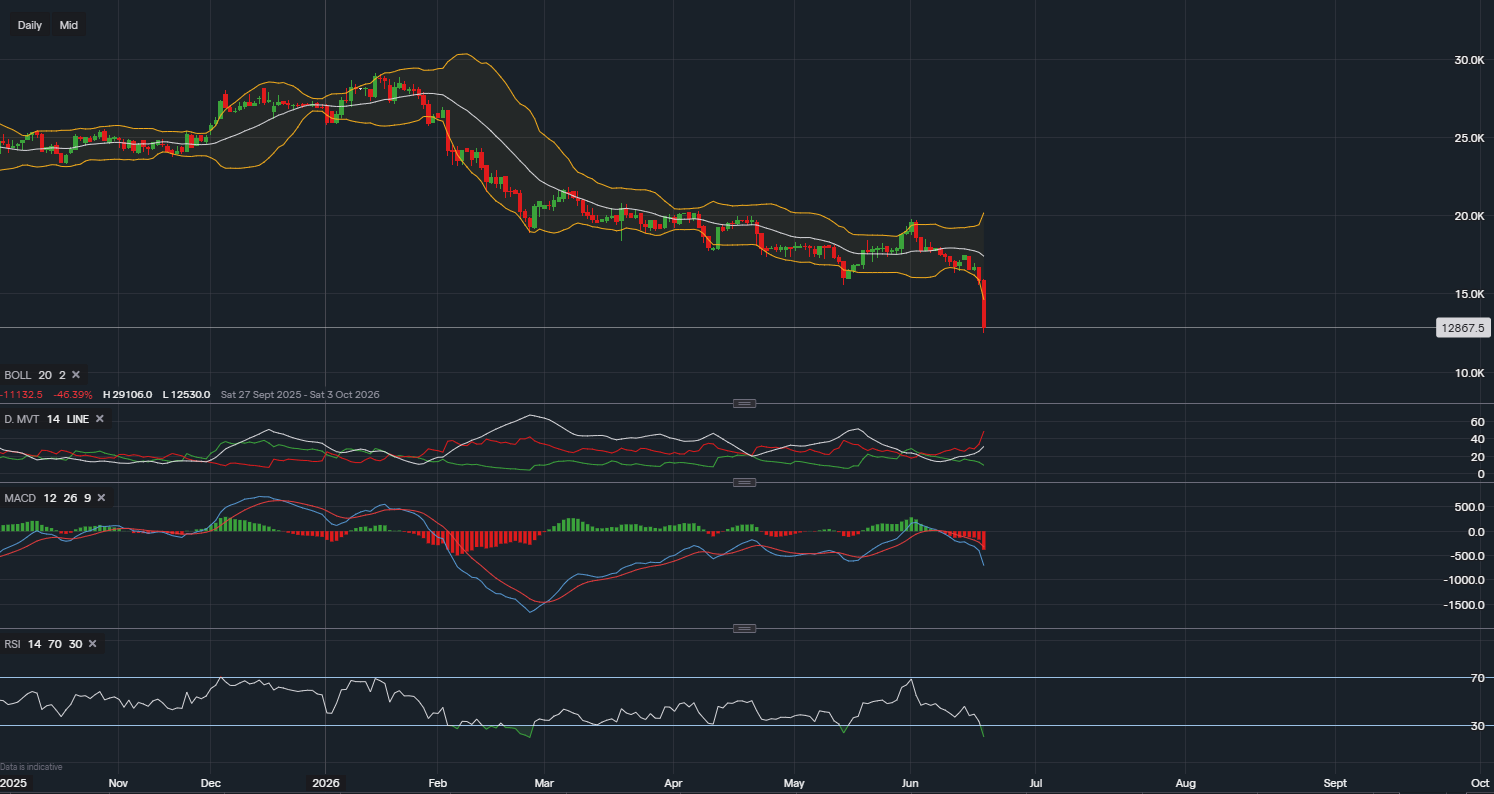
Nike continues to grind higher on the weekly trendline support dating back to October 2022. Support for the stock sits at $121, followed by $116. A cup formation is currently forming with MACD flat on the weekly timeframe, RSI currently reads 56. Towards the upside $129 is a good level to aim for with resistance at $131 March highs. A break above here opens Nike to aim for $180 in the medium term. A break of $116 could see Nike drop to $100.
 Earnings Calendar
  Economic Calendar
  VAT Calculator
  Tax Free Childcare Calculator
 Percentage Calculator
 Compound Interest Calculator
  Loan Overpayment Calculator
 Mortgage Calculator
 Credit Card Calculator
 Investing
  Economics
 Trading
  Technical Analysis
  Personal Finance
 Calculator