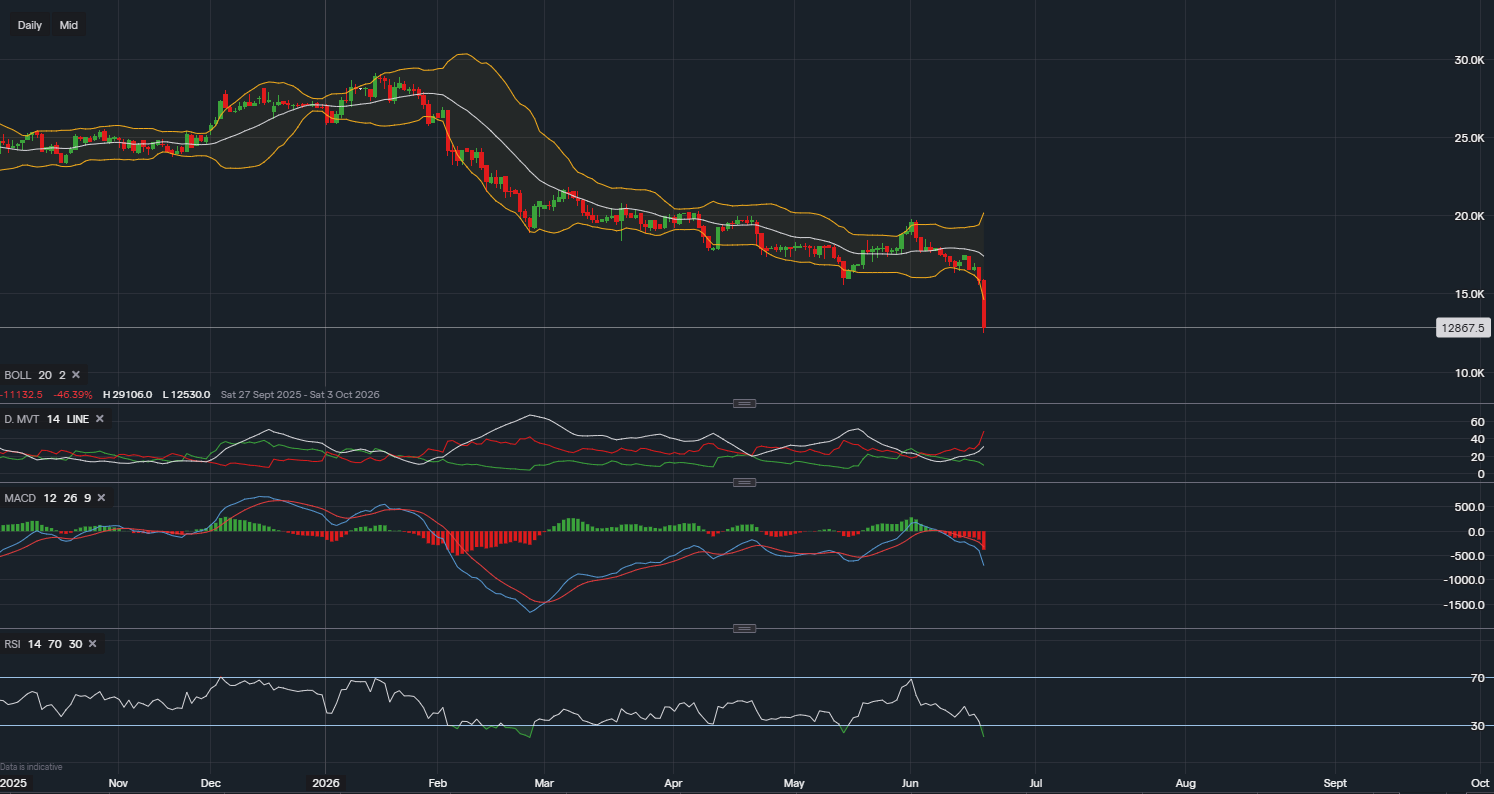
Microsoft Share Price Analysis: Could Oversold RSI Signal a Recovery?
$379.41
29 Jun 2026, 10:01
Bullish

Join Minipip Academy and access free courses in investing, trading, economics, and more.
Sign Up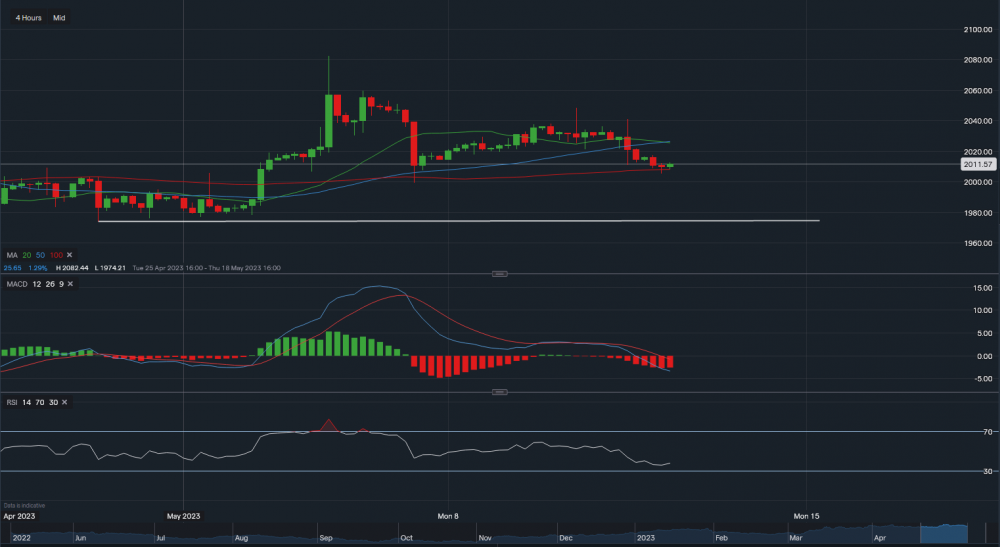
Chart & Data from IG
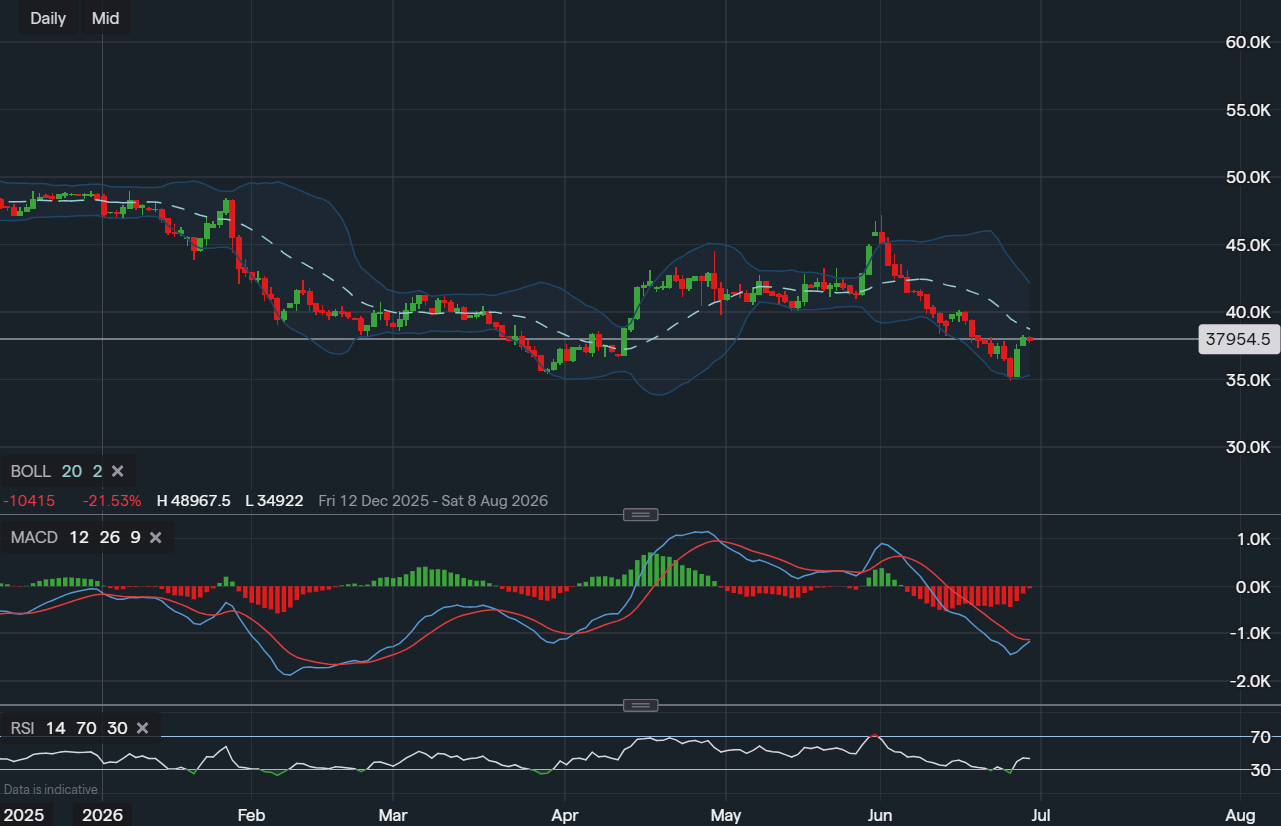
Gold has approached the 100-day moving average on the 4-hourly timeframe, the 100-day MA is acting as a great support level for the commodity. Gold currently trading at around $2,011 an ounce with the support below at $2,008. A break and close below the moving average could see its price slide lower, towards the next major support base resting at $1,974. However, if we see some consolidation around its current level, then resistance above is located at $2,025. Which corresponds with the 20 and 50-day moving averages. A break above $2,025 could see a move higher towards $2,041 and then even $2,048. Looking at the indicators, MACD is negative and so is RSI as it reads 37.

Tradable assets:
Min.Deposit:
Max Leverage:
FCA:

Rating:
 Earnings Calendar
  Economic Calendar
  VAT Calculator
  Tax Free Childcare Calculator
 Percentage Calculator
 Compound Interest Calculator
  Loan Overpayment Calculator
 Mortgage Calculator
 Credit Card Calculator
 Investing
  Economics
 Trading
  Technical Analysis
  Personal Finance
 Calculator