Visa (NYSE:) Technical Analysis: Earnings in Focus as Bullish Momentum Builds
$364.68
28 Jul 2026, 15:59
Neutral

Join Minipip Academy and access free courses in investing, trading, economics, and more.
Sign Up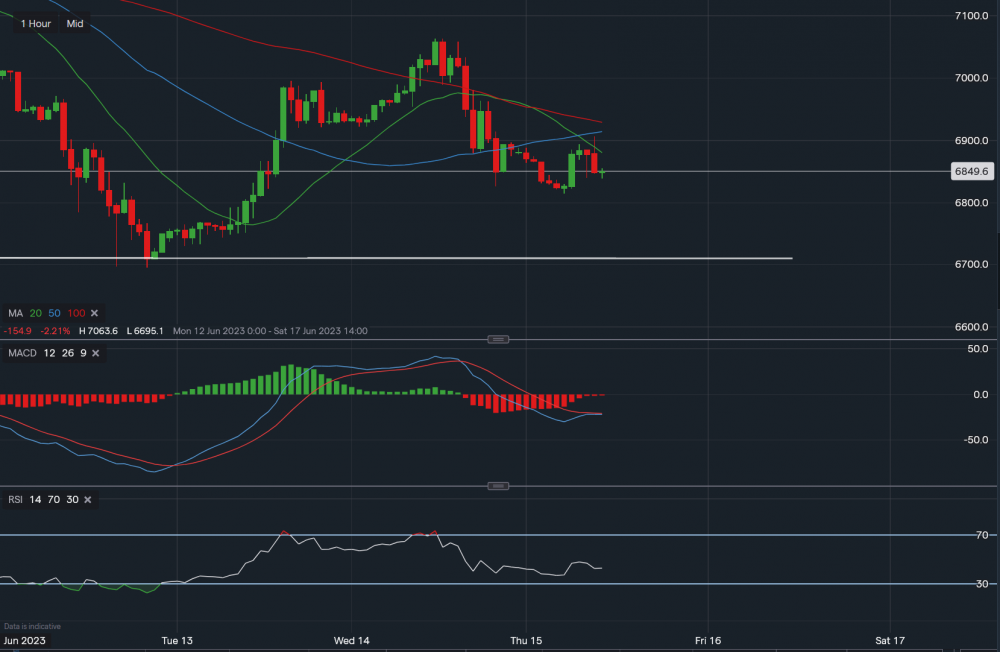
Chart & Data from IG
Taking a look at WTI crude on the 1-hour timeframe as we can see it is trying to consolidate but the resistance is making it tough. It has tried to break above $68.84, and even though the price has temporarily moved above it reaching $69.05, it then quickly pulled back and actually closed at $68.48. Currently, WTI crude is trading at around $68.49 a barrel. Towards the downside, the next level of support sits at $68.14, a break and close below this price could see a move lower towards $67.12. Which is the key support along the white trendline. On the other hand, we may see a turnaround towards the upside as markets are now looking to key Chinese economic data for demand indications. Hence, resistance sits at $68.81 (20-day MA) then at $69.14 (50-day MA) and then at $69.29 (100-day MA). Looking at the indicators, MACD is flat-neutral and RSI is also neutral as it reads 45.

Tradable assets:
Min.Deposit:
Max Leverage:
FCA:

Rating:
 Earnings Calendar
  Economic Calendar
  VAT Calculator
  Tax Free Childcare Calculator
 Percentage Calculator
 Compound Interest Calculator
  Loan Overpayment Calculator
 Mortgage Calculator
 Credit Card Calculator
 Investing
  Economics
 Trading
  Technical Analysis
  Personal Finance
 Calculator


