Adobe Stock Analysis: Can ADBE Recover Ahead of Earnings?
$251.44
08 Jun 2026, 11:14
Neutral

Join Minipip Academy and access free courses in investing, trading, economics, and more.
Sign Up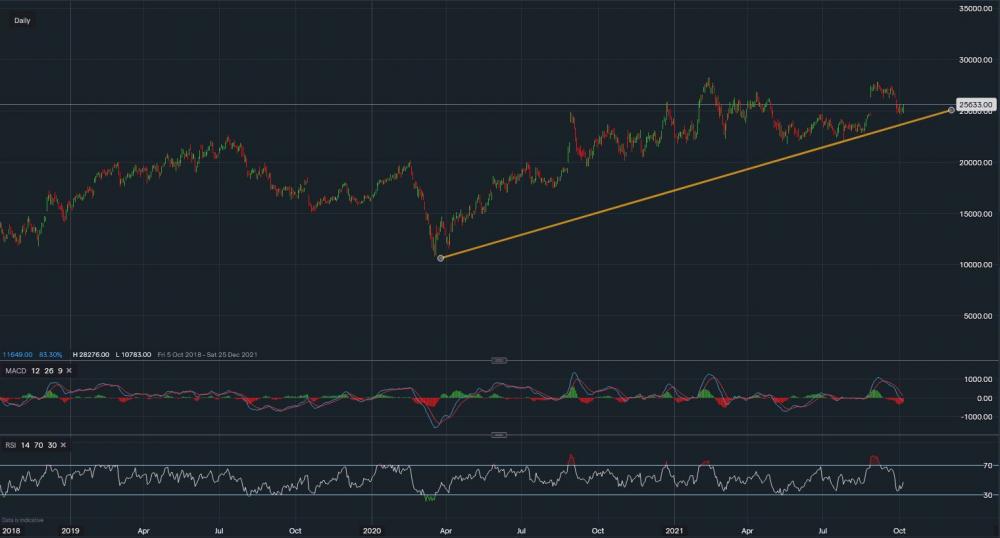
Workday Inc (NASDAQ: "WDAY") is a US-based management systems software provider specialising in HR, Finance and planning. For more information about what they do you can find their website here.
From a financial aspect, the stock is strong. Total market capitalisation is $62.4bn with 2020 revenue at $4.3bn and a loss after tax of $282m. Looking into this year turnover will be about $4.9bn with a potential to turn a profit of about $100m. looking at the balance sheet, cash on hand is $3.3bn with total assets at $9.1bn. Total liabilities sit at $5.245bn, leaving net positive $3.86bn. This gives Workday a L/A ratio of 73.5% which is quite high for a tech company.
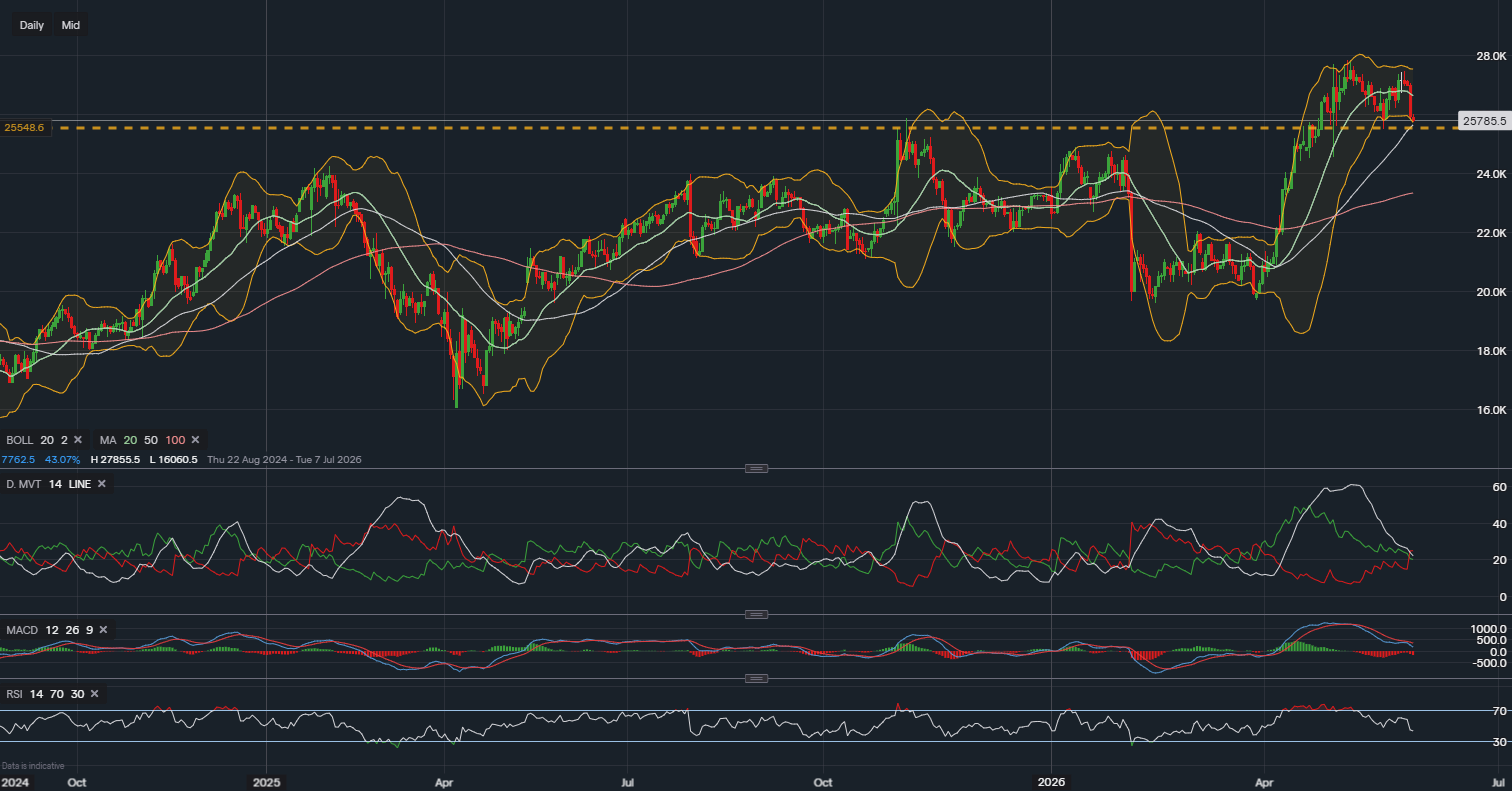
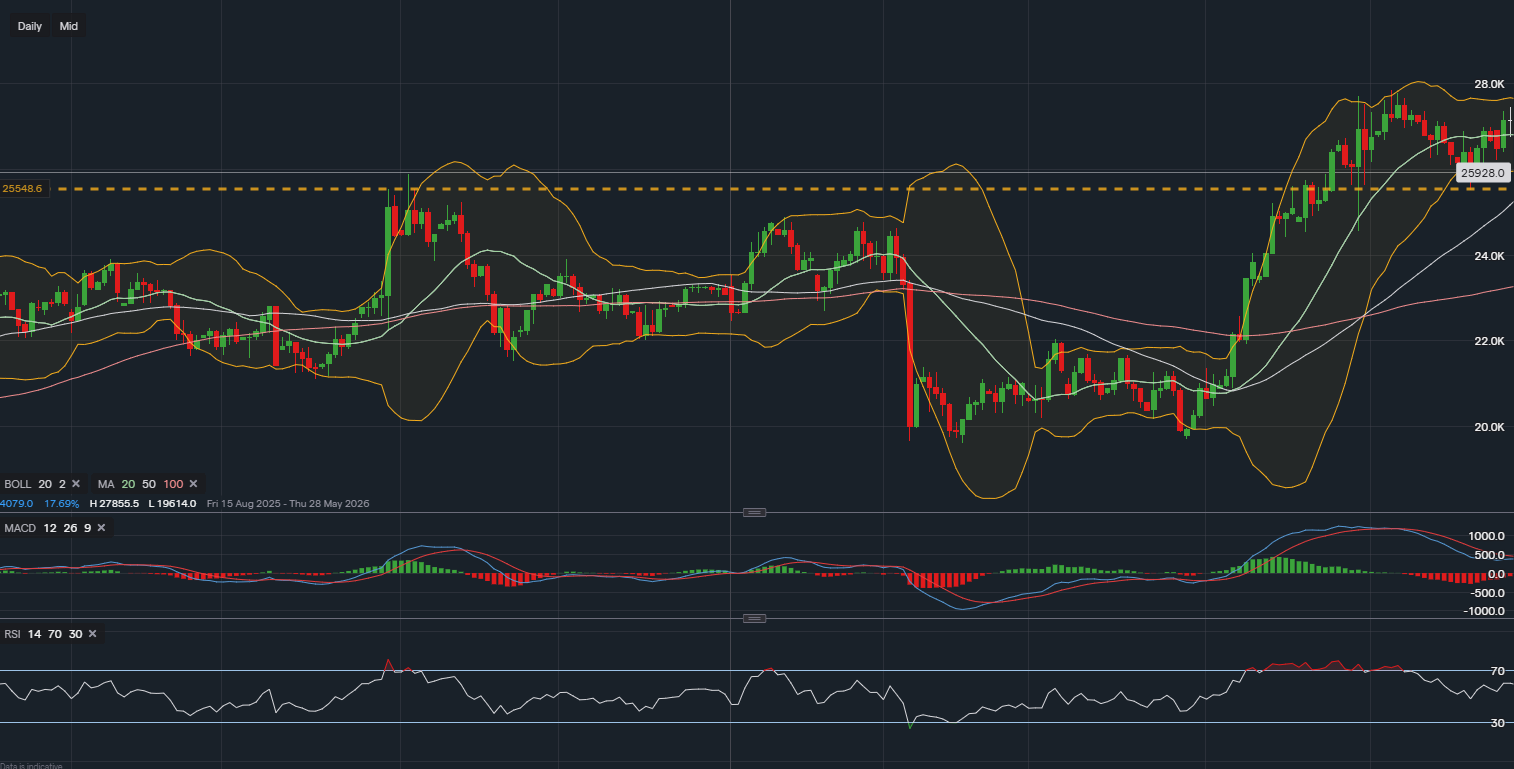
From a technical aspect, the stock looks strong and the recent drop could provide a buying opportunity. MACD is negative but looks to be bottoming out. The RSI reads 47 giving a neutral direction. Support for the stock sits at $246 followed by $229 and then $216. A clear break below here could signal further downside. Looking to the upside initial targets are $278 followed by $300.
Overall this stock is well placed within its industry, tie this in with potential profitability this year investors are getting excited. Workday is on the risker side of things as a $60bn valuation could give doubts as to how further it can go. Is a $4-$6bn turnover business worth $60/$80bn? - Of which makes a $100m profit.
 Earnings Calendar
  Economic Calendar
  VAT Calculator
  Tax Free Childcare Calculator
 Percentage Calculator
 Compound Interest Calculator
  Loan Overpayment Calculator
 Mortgage Calculator
 Credit Card Calculator
 Investing
  Economics
 Trading
  Technical Analysis
  Personal Finance
 Calculator