Visa (NYSE:) Technical Analysis: Earnings in Focus as Bullish Momentum Builds
$364.68
28 Jul 2026, 15:59
Neutral

Join Minipip Academy and access free courses in investing, trading, economics, and more.
Sign Up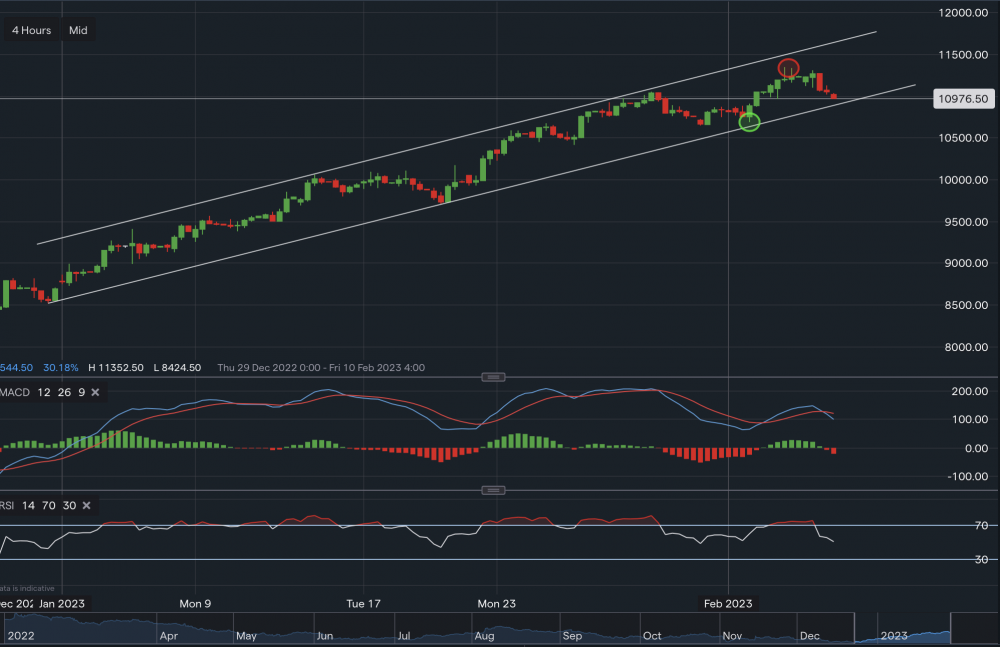
Disney - Chart & Data from IG
Financials
Despite recession concerns, Disney’s revenue increased to $82.7 billion from $67.4 billion in the fiscal year of 2022, while gross profit increased to $28.3 billion from $22.3 billion. Additionally, EBITDA rose by $3.5 billion year on year, and profit after tax and costs rose to $3.1 billion from $2 billion in 2021. Consequently, earnings per share were reported at $1.73 for the year, representing a significant improvement for the corporation when comparing to the previous two fiscal years. In 2020, the EPS was negative, and in 2021, it was $0.63 lower than in 2022, highlighting the modest financial recovery since the Covid pandemic. Furthermore, the value of its total assets has stayed consistent on the balance sheet, but Disney has managed to cut its total liabilities by $6 billion from the previous year. As a result, the company's total equity has increased by $5.8 billion year on year.
Technicals
From a technical overview, Dinsey’s shares are trading at around $109.76 a share. We can see that the longer-term bias is still bullish, although since Friday a small bearish trend has form. For the bearish trend to continue further and potentially lead to a reversal trend, a break below roughly $108.86 (sitting on lower white trendline) could see the price decline as far as $106.92. A break below $106.92 (green oval) may hint a reversal trend suggesting that bears could take control. However, until then, the support still rests firmly below. Hence, towards the upside, resistance sits at $110.58 then at $113.14 then a key level at $113.52. A break above the key level may see the price of this stock head higher, targeting $115-$116. Looking at the technical indicators, MACD has turned negative on the MACD but RSI is neutral as it reads 50.
 Earnings Calendar
  Economic Calendar
  VAT Calculator
  Tax Free Childcare Calculator
 Percentage Calculator
 Compound Interest Calculator
  Loan Overpayment Calculator
 Mortgage Calculator
 Credit Card Calculator
 Investing
  Economics
 Trading
  Technical Analysis
  Personal Finance
 Calculator


