Visa (NYSE:) Technical Analysis: Earnings in Focus as Bullish Momentum Builds
$364.68
28 Jul 2026, 15:59
Neutral

Join Minipip Academy and access free courses in investing, trading, economics, and more.
Sign Up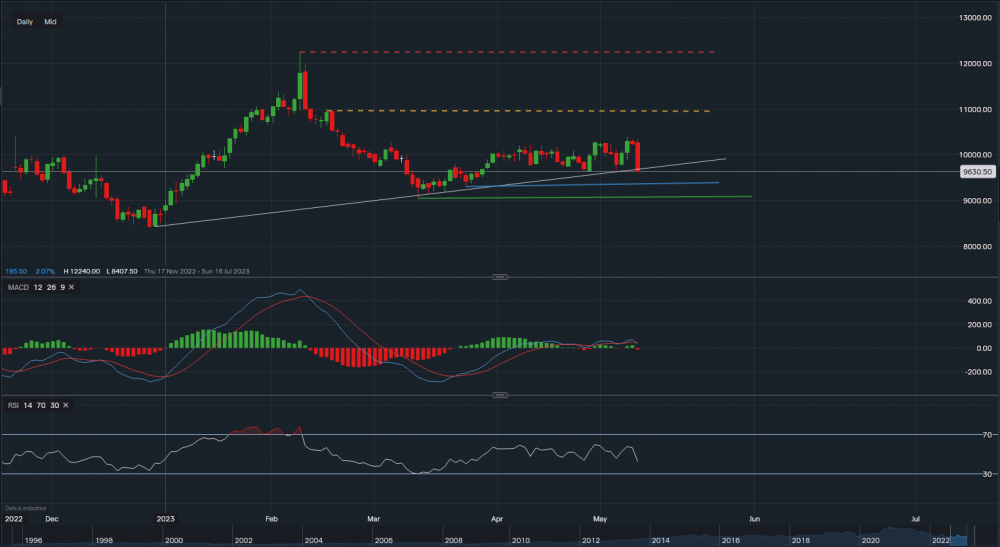
Chart & Data from IG
Just taking a quick glance at Disney after its earnings report yesterday. The company's Q2 profits were worse than expected, with EPS of $0.93 falling short of the average estimate of $0.95. Revenue increased 13% from the prior year to $21.82 billion, as anticipated. Revenues at Linear Networks fell 7% to $6.6 billion, and operating income fell 35% to $1.8 billion. Direct-to-consumer sales increased by 12% to $5.5 billion, while operating loss shrank by $0.2 billion to $0.7 billion as an outcome of better Disney+ and ESPN+ performance, which was largely offset by reduced operating income at Hulu.
Disney+ experienced improved results due to greater programming and production costs and, to a lesser degree, higher technological costs, which were somewhat offset by higher subscriber income, reduced marketing expenses, and more material being offered on the platform. Disney's subscriber growth and price hikes contributed to the higher subscription income, which was only slightly offset by a negative foreign exchange effect.
Revenues for the Disney Parks, Experiences, and Products segment climbed by 17% to $7.8 billion, while segment operating income rose by 23% to $2.2 billion, indicating growth in the company's domestic and foreign parks and experiences businesses, which was somewhat offset by weaker performance in its product licensing business.
Its stock is now trading at around $96.30 a share. We can see that the price has dipped below the support levels of $96.62 and $96.41, therefore, we could now see a further retracement towards the next line of support sitting at $93.04 (blue trendline). Followed by this is a key support base at $90.48 (green trendline), a break below the green trendline may see a slide all the way down towards $84.07. $84.07 was the very low point of 2022. Towards the upside, $96.62 is now acting as resistance, followed by this is $97.93 then $100.84. A break above $100.84 could see a move again towards $102-$103. Looking at the indicators, MACD has turned negative and so is RSI as it now reads 42.

Tradable assets:
Min.Deposit:
Max Leverage:
FCA:

Rating:
 Earnings Calendar
  Economic Calendar
  VAT Calculator
  Tax Free Childcare Calculator
 Percentage Calculator
 Compound Interest Calculator
  Loan Overpayment Calculator
 Mortgage Calculator
 Credit Card Calculator
 Investing
  Economics
 Trading
  Technical Analysis
  Personal Finance
 Calculator


