Analysis
DAX Pulls Back From All Time Highs: Healthy Pause or Warning Sign?
$25355
10 Sep 2026, 17:04
Neutral


Join Minipip Academy and access free courses in investing, trading, economics, and more.
Sign Up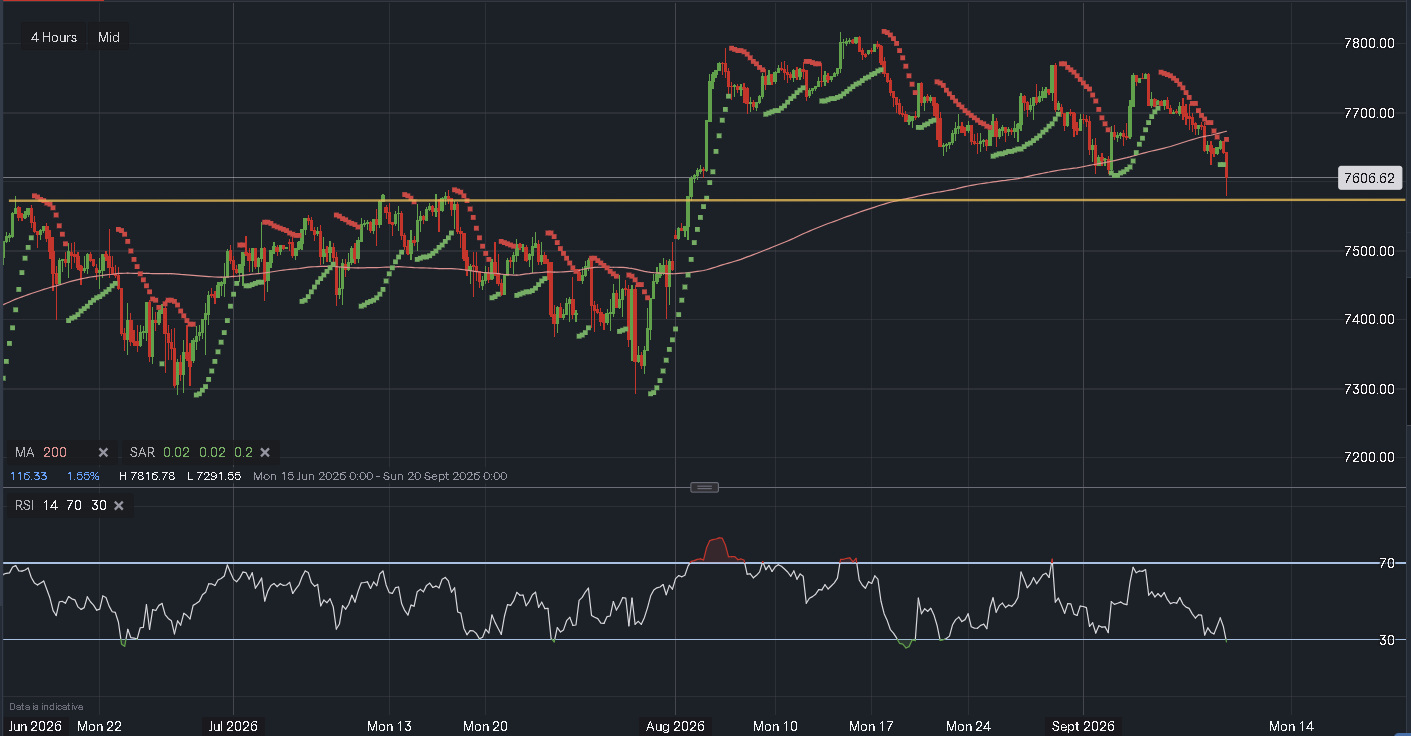
IG Data - Timeframe - 4H


The US500 is approaching an important technical area on the 4H chart as price pulls back towards the 7,606 support level. This zone previously acted as a significant resistance area during the consolidation seen throughout June and July, before the index broke higher in a strong move at the beginning of August. With price now returning to this area, the reaction around 7,606 could play an important role in determining the next move.
200-Period Moving Average Remains Key
The 200-period moving average continues to provide an important view of the broader trend. Although the recent price action has become more volatile, the moving average is still pointing upwards, suggesting that the wider trend remains positive. However, price has recently moved below the 200-period moving average for the first time in several weeks. This represents a shift in the short-term picture and shows that sellers are currently putting greater pressure on the market.
Sellers Take Short-Term Control
The recent weakness is also reflected by the Parabolic SAR, with the dots now positioned above the price candles. The red sequence has continued to track lower as the index has declined, indicating that sellers remain in control of the immediate price action. While this does not confirm a complete reversal of the broader trend on its own, it does suggest that buyers need to regain momentum if the market is to recover.
US500 Momentum Continues to Weaken
The Relative Strength Index (RSI) at the bottom of the chart also highlights the change in momentum. Following the strong advance in early August, the RSI moved down from overbought conditions and has continued to decline. It is now sitting just above the 30 level, which is generally considered the oversold threshold. This shows that selling pressure has become significant, although the RSI has not yet moved deeply into oversold territory.
RSI Could Be Approaching a Turning Point
With the RSI now close to 30, traders will be watching to see whether momentum begins to stabilise. A move into oversold territory does not automatically mean the market will reverse higher, but it can indicate that selling pressure is becoming stretched. If the RSI begins to turn upwards while price holds the 7,606 support area, it could provide an early sign that the current pullback is losing momentum.
Parabolic SAR Could Confirm a Recovery
The Parabolic SAR will also be important if buyers attempt to regain control. A flip in the dots from above the candles to below price would indicate that the short-term trend is beginning to improve. If this happens alongside a recovery in the RSI, the combination would provide a stronger technical indication that the selling phase may be coming to an end.
7,606 Support Could Decide the Next Move
For now, 7,606 is the key level to watch on the US500. If buyers successfully defend this support, the index could begin to stabilise and potentially move back towards higher resistance levels. A sustained break below 7,606, however, would weaken the current technical structure and could expose the index to further downside as traders look for the next area of support.
US500 Outlook: Buyers Need to Regain Control
Overall, the US500 remains at an important technical crossroads. The rising 200-period moving average continues to support the broader bullish structure, but the recent move below the average, bearish Parabolic SAR and falling RSI show that short-term momentum has shifted towards sellers. The reaction around 7,606 support could therefore be crucial.
If the index holds this level and momentum begins to improve, the current decline could prove to be a correction within the wider uptrend. However, a confirmed break below support would increase the risk of a deeper pullback. For now, traders and investors will be watching the 7,606 support level, the 200-period moving average, RSI and Parabolic SAR closely for signs of where the US500 could move next.
Disclaimer
This analysis is for informational purposes only and does not constitute financial advice.

Tradable assets:
Min.Deposit:
Max Leverage:
FCA:

Rating:
 Earnings Calendar
  Economic Calendar
  VAT Calculator
  Tax Free Childcare Calculator
 Percentage Calculator
 Compound Interest Calculator
  Loan Overpayment Calculator
 Mortgage Calculator
 Credit Card Calculator
 Investing
  Economics
 Trading
  Technical Analysis
  Personal Finance
 Calculator