Analysis
American Express (AXP) Stock Forecast: Technical Analysis Ahead of Earnings
$323.99
22 Oct 2026, 19:04
Neutral


Join Minipip Academy and access free courses in investing, trading, economics, and more.
Sign Up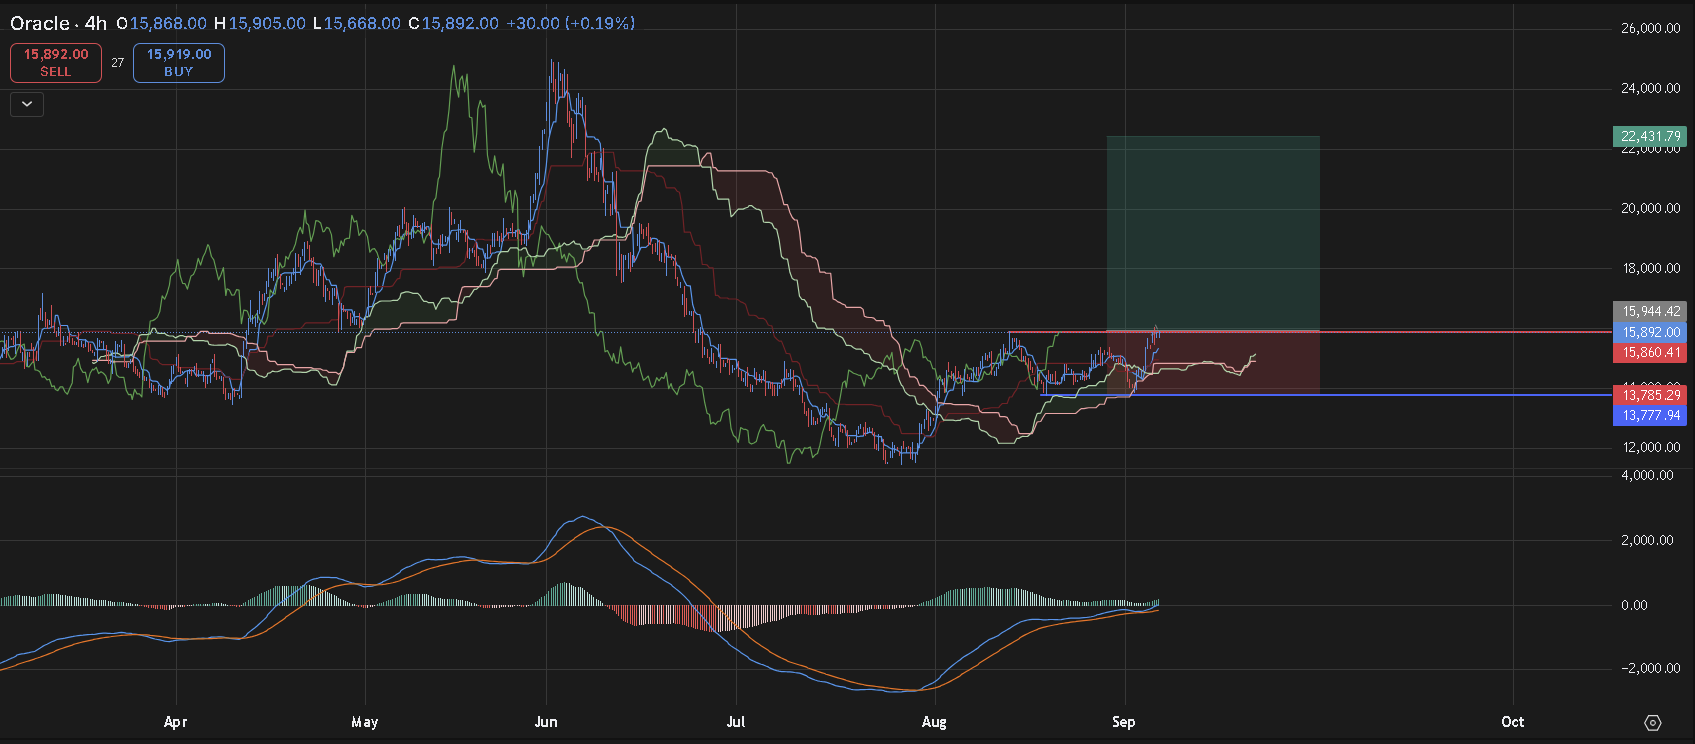
Capital Data - Timeframe - 4H


Oracle is heading into a potentially important week, with its next earnings report scheduled for Thursday, 10 September 2026, after the market closes. Analysts are currently expecting earnings per share of around $1.74, compared with $1.47 for the same quarter last year. That would represent an increase of roughly 18% year on year.
With earnings just around the corner, the four-hour chart is starting to become particularly interesting. Oracle has been recovering from the weakness seen earlier in the summer, and price is now approaching an area that could determine whether this recovery has further room to run.
Oracle Price Approaches Key Resistance
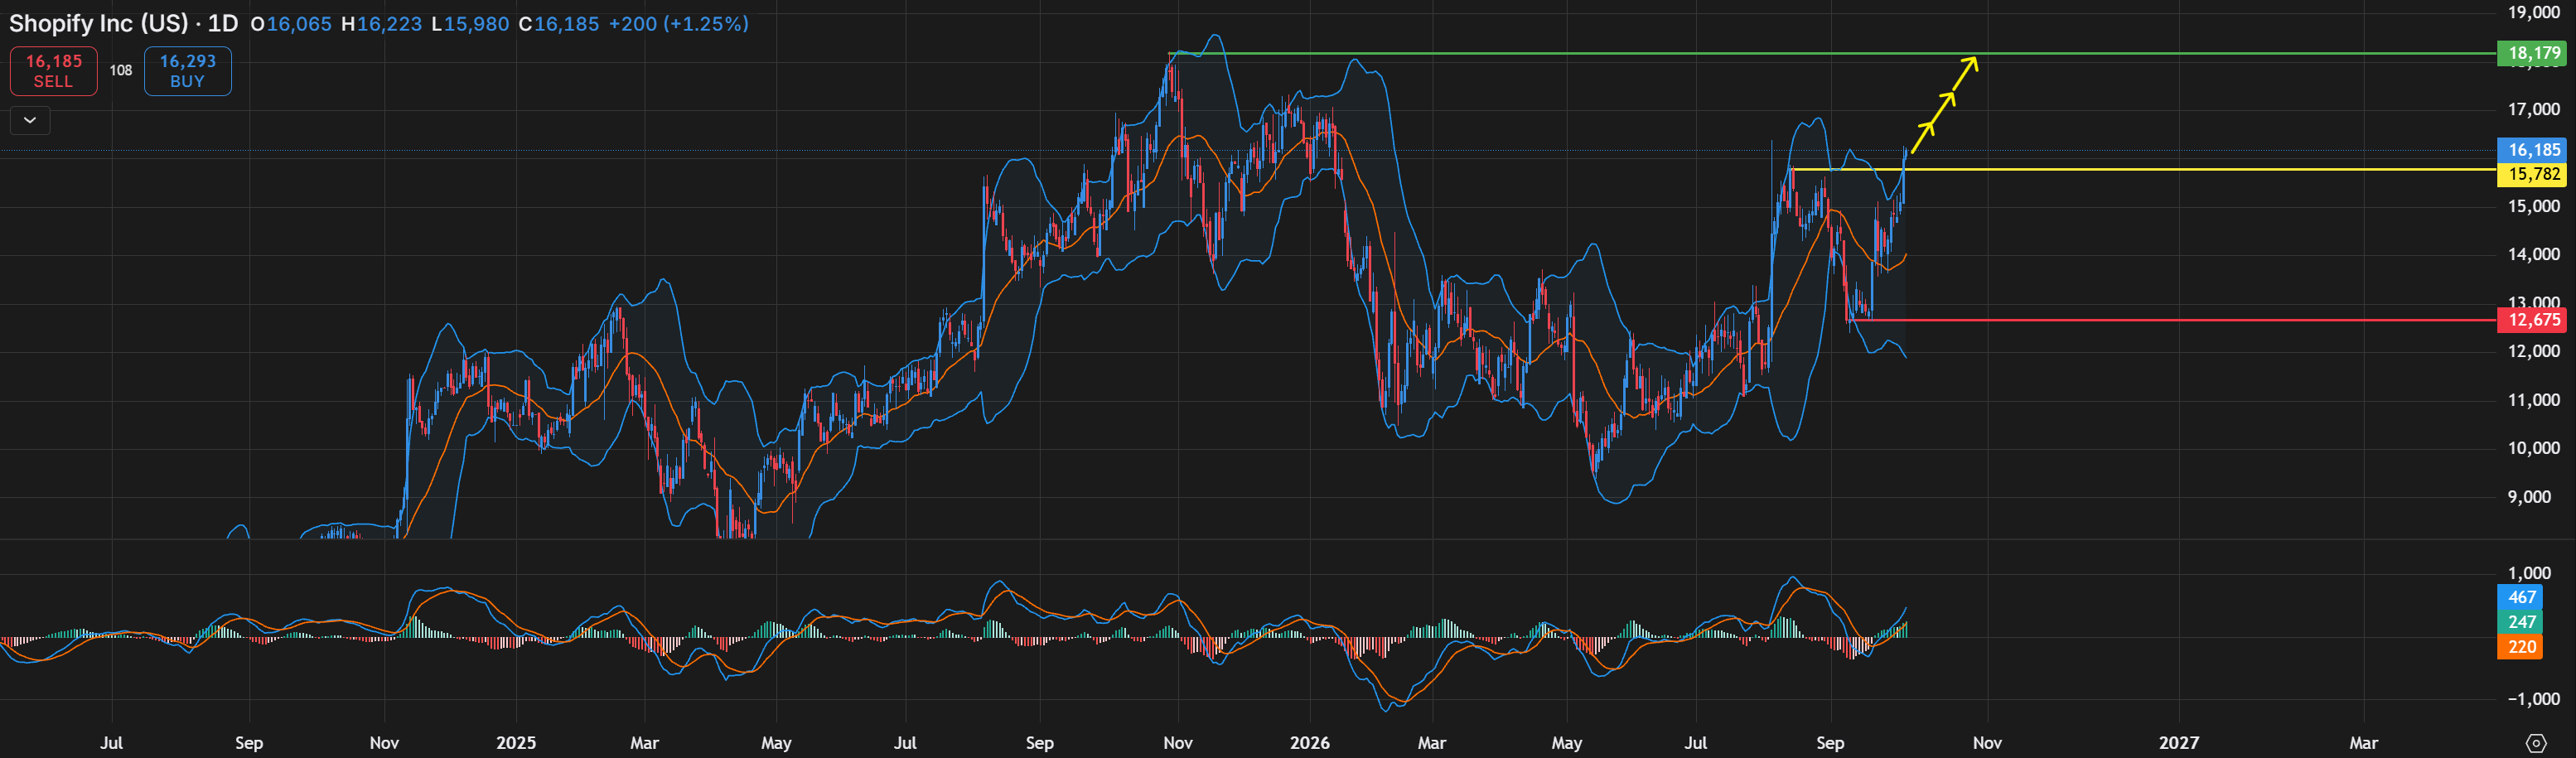
Looking at the four-hour chart, Oracle is currently trading around 15,892, with price moving towards the 15,944 resistance area.
This is an important level because price has been trading within a fairly tight range. Buyers have managed to push the stock higher, but the market has yet to make a clear break above this resistance.
If Oracle can move above 15,944 and hold that level, it would give the current recovery considerably more strength. This would also make the possibility of a larger upside move more interesting, particularly if the earnings announcement provides the catalyst buyers are waiting for.
Ichimoku Cloud Shows Oracle Recovering
The Ichimoku Cloud is also starting to show signs of improvement on the four-hour timeframe.
After falling heavily through June and July, Oracle eventually found support around the July lows and has since started to recover. Price has gradually moved higher, creating a much more constructive structure than the one seen during the previous decline.
The main question now is whether this recovery can continue through the resistance currently sitting around 15,944.
A successful move above this area would provide a stronger bullish signal, while remaining below it would suggest that Oracle is still caught within its current trading range.
MACD Shows Bullish Momentum Building
The MACD is giving the chart another interesting signal.
The MACD line has moved above the signal line, while the histogram has also moved into positive territory. This indicates that bullish momentum has been building as Oracle has recovered from its previous lows.
What is particularly interesting is how the MACD has moved from deeply negative levels during the July decline and has gradually worked its way back towards the zero line.
If the MACD continues to remain above the signal line and the positive histogram begins to expand, it would suggest that buyers are continuing to gain momentum.
For traders watching the shorter-term price action, this is an area worth keeping an eye on because a strengthening MACD alongside a break of resistance could provide a much clearer bullish setup.
Could Oracle Reach 22,431?
The chart currently shows a potential upside target around 22,431.79.
That is a significant distance above the current price, so it would not be something that should be expected to happen immediately. Instead, it represents a potential longer-term price objective if Oracle can first break through its current resistance and build enough momentum to continue higher.
The first level that really matters is still 15,944. If Oracle cannot break this level, the 22,431 target becomes much less relevant in the short term.
However, if price breaks through resistance, holds above it and continues to build momentum, the higher target becomes considerably more interesting.
Support Levels Remain Important
While the focus is currently on the upside, it is equally important to keep an eye on where buyers need to defend the price.
The chart shows an important support area around 13,785–13,778. This region has acted as an important reference point within the current structure.
As long as Oracle remains above this area, the recent recovery remains intact from a technical perspective.
A significant move below this support, however, would change the picture and suggest that the current bullish recovery is losing strength.
Earnings Could Be the Catalyst
This is where Thursday's earnings report becomes particularly important.
The technical picture is already showing improving momentum, but earnings could be the event that finally pushes Oracle out of its current range.
If the company reports stronger-than-expected results and the market reacts positively, we could see increased buying pressure around the stock. That could potentially help Oracle break through the 15,944 resistance level.
On the other hand, if the results or forward outlook disappoint investors, the reaction could be very different. Earnings announcements can create large price movements in either direction, meaning the technical setup can change very quickly once the numbers are released.
Analyst Sentiment Remains Positive
Analyst sentiment towards Oracle remains largely positive, although not every analyst expects the same level of growth.
According to the latest TipRanks data, 32 analysts currently cover Oracle, with 28 giving the stock a Buy rating and four giving it a Hold rating. There are currently no Sell ratings in that group, giving Oracle an overall Strong Buy consensus.
The price targets also vary considerably. Bank of America has a $240 target, Bernstein has $325, and Jefferies has $290. Morgan Stanley has a $210 Hold target, while RBC Capital has a $190 Hold rating.
For investors, this simply means that most analysts remain positive about where Oracle could be heading over the next 12 months, although there is still some disagreement about how high the stock could go.
For traders, these targets can also provide useful reference points when looking at the bigger picture, particularly if the technical trend begins to turn strongly bullish.
Oracle Stock Outlook for Investors
From an investor's perspective, the bigger picture is about whether Oracle can continue building on the recovery that has developed since the July lows.
The combination of improving price action, the Ichimoku Cloud and a MACD that has moved back into bullish territory provides an encouraging technical picture.
However, the stock still needs to prove itself by breaking through the 15,944 resistance level.
A successful breakout could indicate that buyers are beginning to take greater control, while a rejection from this area could mean that Oracle needs more time to consolidate before making its next major move.
Oracle Stock Outlook for Traders
For traders, the four-hour chart provides a much clearer area to watch.
A break above 15,944, particularly if supported by increasing MACD momentum, could indicate that buyers are gaining control and that the current range may be coming to an end.
Alternatively, if Oracle continues to struggle around resistance, traders may look for the stock to remain within its existing range and monitor how price behaves around the lower support area.
The shorter timeframes could then provide more detail for those looking at intraday or swing-trading opportunities.
The Bigger Picture for Oracle
Overall, Oracle is approaching earnings with an interesting technical setup.
The stock has recovered from its July decline, the MACD has turned bullish, the Ichimoku structure is improving and price is now approaching the 15,944 resistance level.
At the same time, analysts remain largely positive, with 28 of the 32 analysts tracked by TipRanks currently carrying Buy ratings.
The real test now comes with Thursday's earnings report.
If Oracle delivers stronger-than-expected results and the market responds positively, the combination of earnings momentum and the current technical setup could provide the catalyst needed for a breakout.
For now, 15,944 remains the key level to watch on the upside, while 13,785–13,778 remains an important support area. Above resistance, the chart points towards 22,431.79 as a longer-term potential objective.
The next major move could therefore come down to one simple question: can Oracle turn its current recovery into a confirmed breakout?
Disclaimer
This technical analysis is provided for informational and educational purposes only and should not be considered financial advice, investment advice, or a recommendation to buy or sell any financial instrument. Investors and traders should conduct their own research and consider their individual circumstances before making any investment decisions.

Tradable assets:
Min.Deposit:
Max Leverage:
FCA:

Rating:
 Earnings Calendar
  Economic Calendar
  VAT Calculator
  Tax Free Childcare Calculator
 Percentage Calculator
 Compound Interest Calculator
  Loan Overpayment Calculator
 Mortgage Calculator
 Credit Card Calculator
 Investing
  Economics
 Trading
  Technical Analysis
  Personal Finance
 Calculator