Analysis
DAX Pulls Back From All Time Highs: Healthy Pause or Warning Sign?
$25355
10 Sep 2026, 17:04
Neutral


Join Minipip Academy and access free courses in investing, trading, economics, and more.
Sign Up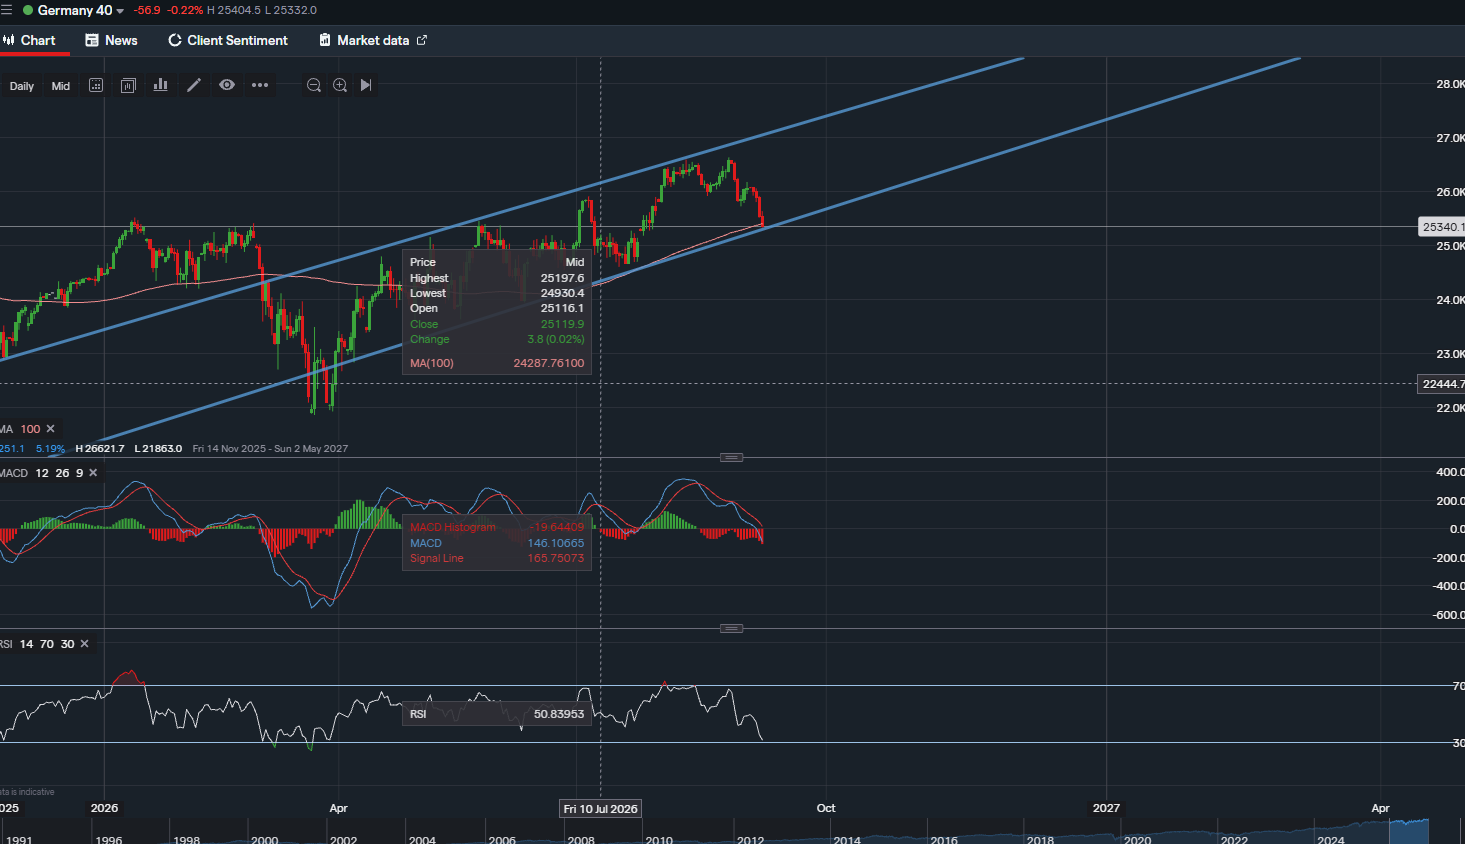
DAX Pulls Back From All Time Highs: Healthy Pause or Warning Sign?


The DAX Cools Off From Record Highs: What the Charts Say Next
The DAX, Germany's benchmark index of forty large companies listed in Frankfurt, has spent the last several weeks giving back some of the gains from its summer rally. After pushing to a fresh all time high near 26,630 in late August, the index has pulled back and is now trading around 25,340, down roughly 57 points, or 0.22 percent, on the session. Zooming out on the daily chart, that pullback becomes a lot easier to read once you draw a rising channel across the highs and lows going back to last November. Price is currently sitting right at the lower edge of that channel, which makes this a genuinely useful spot to watch.
What the indicators are showing
The 100 day moving average, plotted on the chart as the pink line, is still sloping upward and sits well below current price, around the 24,300 area. This is a simple but useful way to judge the bigger picture trend. When price sits above a rising moving average, it tells us the underlying trend is still bullish even if the last few weeks have been rocky. Think of the 100 day average as a slow moving guide to where the index has been trading on balance over the last five months. As long as the DAX holds above it, buyers are still broadly in control, and right now there is a decent cushion between the two.
The MACD tells a slightly different story about momentum in the shorter term. After running hot through the summer rally, with the MACD line well above zero and the histogram bars tall and green, the recent decline has pulled the MACD line back down toward and now below its signal line, and the histogram bars have flipped negative. That is a normal pattern after a strong advance. It reflects the fact that buying pressure has eased rather than reversed outright. If the MACD line keeps sliding further below the signal line and the histogram stays red, that would point to further near term weakness. If it curls back up, it would suggest the pullback is losing steam.
RSI adds useful context here too. At 14 periods, RSI is sitting right around the midpoint of its range, comfortably below the overbought 70 level and well above the oversold 30 level. Earlier this year RSI did dip toward oversold territory during a sharper correction, so the index has clearly seen more volatile stretches than this one. The current reading suggests the recent pullback has worked off the overbought pressure that had built up during the run to the all time high, without tipping into oversold conditions. In other words, this still looks like healthy consolidation rather than panic selling.
The fundamental backdrop
The timing of this pullback lines up closely with the European Central Bank's policy meeting. The ECB is widely expected to raise its key rates by another 25 basis points, taking the deposit rate to around 2.50 percent, as policymakers continue to lean against inflation pressure that has been stoked by rising energy prices tied to ongoing tensions in the Middle East. Higher rates tend to weigh on equity valuations because they raise the cost of borrowing for companies and make bonds relatively more attractive to investors, so markets have been trading cautiously into the decision.
Underneath the index level moves, individual stocks have told very different stories. Defense names like Rheinmetall have continued to attract buying interest on favorable analyst commentary, while technology and industrial names such as Infineon have come under pressure following rating downgrades. Beiersdorf was also cut to Sell by Deutsche Bank, adding to the mixed picture among consumer names. This kind of split performance across sectors is typical of a market that is digesting a fast run higher and waiting for the next clear catalyst, whether that is central bank guidance, corporate earnings, or developments in the geopolitical backdrop.
Key levels to watch
Rather than relying on a single fixed price for support and resistance, the more useful picture here comes from the rising channel that has contained the DAX since last November. The lower boundary of that channel has been tested and held on multiple occasions, first around the turn of the year and again during the spring pullback, and price is testing it again right now near the 25,300 to 25,400 area. As long as the index continues to respect this rising trendline, the broader uptrend structure stays intact, even though the exact price where it offers support will keep drifting higher over time.
The upper boundary of the channel is the flip side of that story. It currently sits well above current price, tracking up toward the 27,000 to 28,000 zone over the coming months, and it roughly lines up with the area where the index topped out after its most recent push to new highs. A move back up toward that line would put the recent all time high near 26,630 back in play as the next test.
A clean break below the lower trendline would be the more important signal to watch for a shift in trend. That would suggest the channel that has guided this rally since November is no longer holding, and it would open the door to a deeper pullback toward the next layer of support, including the rising 100 day moving average near 24,300.
The bottom line
The DAX remains in a longer term uptrend, with price still above its rising 100 day moving average and currently testing the lower boundary of the ascending channel that has defined this rally since last November. Momentum has cooled rather than reversed, and RSI shows no sign of panic selling. How price behaves at this trendline test is the key thing to watch over the next few sessions. A bounce here would keep the broader uptrend on track toward new highs, while a decisive break below it would be the clearer warning sign that the rally needs a deeper reset.

Tradable assets:
Min.Deposit:
Max Leverage:
FCA:

Rating:
 Earnings Calendar
  Economic Calendar
  VAT Calculator
  Tax Free Childcare Calculator
 Percentage Calculator
 Compound Interest Calculator
  Loan Overpayment Calculator
 Mortgage Calculator
 Credit Card Calculator
 Investing
  Economics
 Trading
  Technical Analysis
  Personal Finance
 Calculator