UnitedHealth Group Analysis: Defensive Healthcare Scale Amid Regulatory and Margin Pressures
$407.34
12 Jun 2026, 17:06
Neutral

Join Minipip Academy and access free courses in investing, trading, economics, and more.
Sign Up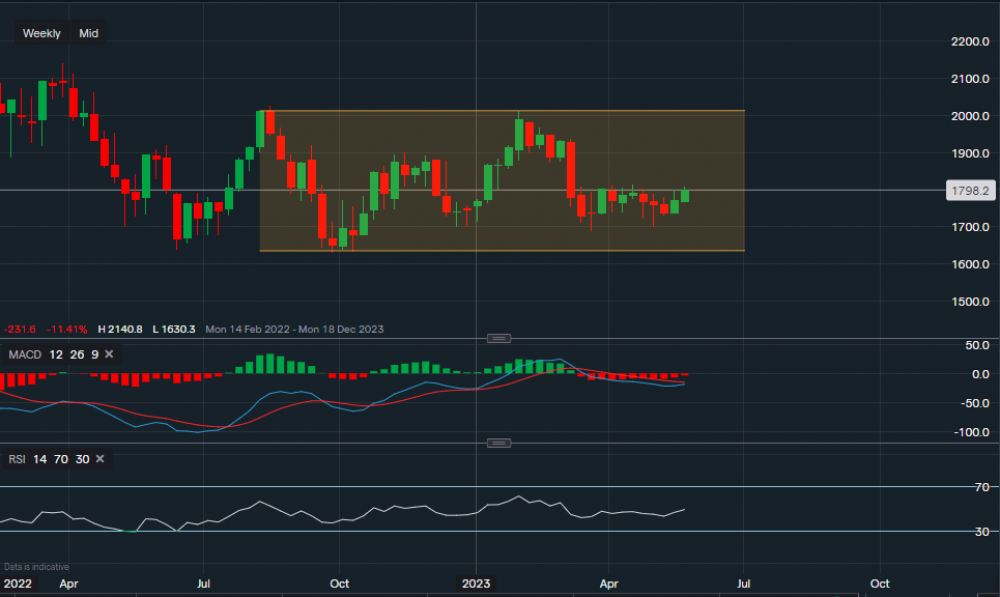
Chart & Data from IG
Taking a look at the US Russell 2000 index for a longer-term outlook, currently trading at around 1,798. From a technical viewpoint, we can see that the index has formed two fundamental levels of support with the first one at 1,689 followed by the more important one at 1,630 (bottom of the channel). A break below 1,630 could see a fall to as low as 1400-1500, although this will only be more likely if the US debt ceiling is not extended. As the base has been formed, investors and traders will be looking towards the upside. Hence, the index will face resistance at 1,814 and then at 1,900. A break above 1,900 could see an attempt back up to the 2,000 level (top of the channel). At the moment, the index is positing itself for a move higher. If the debt ceiling is extended, the likelihood of any bullish moves will rise. The technical indicators are slightly mixed, the MACD is negative but seems like it’s turning neutral-positive, and the RSI is neutrals as it reads 49.

Tradable assets:
Min.Deposit:
Max Leverage:
FCA:

Rating:
 Earnings Calendar
  Economic Calendar
  VAT Calculator
  Tax Free Childcare Calculator
 Percentage Calculator
 Compound Interest Calculator
  Loan Overpayment Calculator
 Mortgage Calculator
 Credit Card Calculator
 Investing
  Economics
 Trading
  Technical Analysis
  Personal Finance
 Calculator


