Oracle Share Price Outlook: Could Oversold RSI Signal a Bullish Reversal?
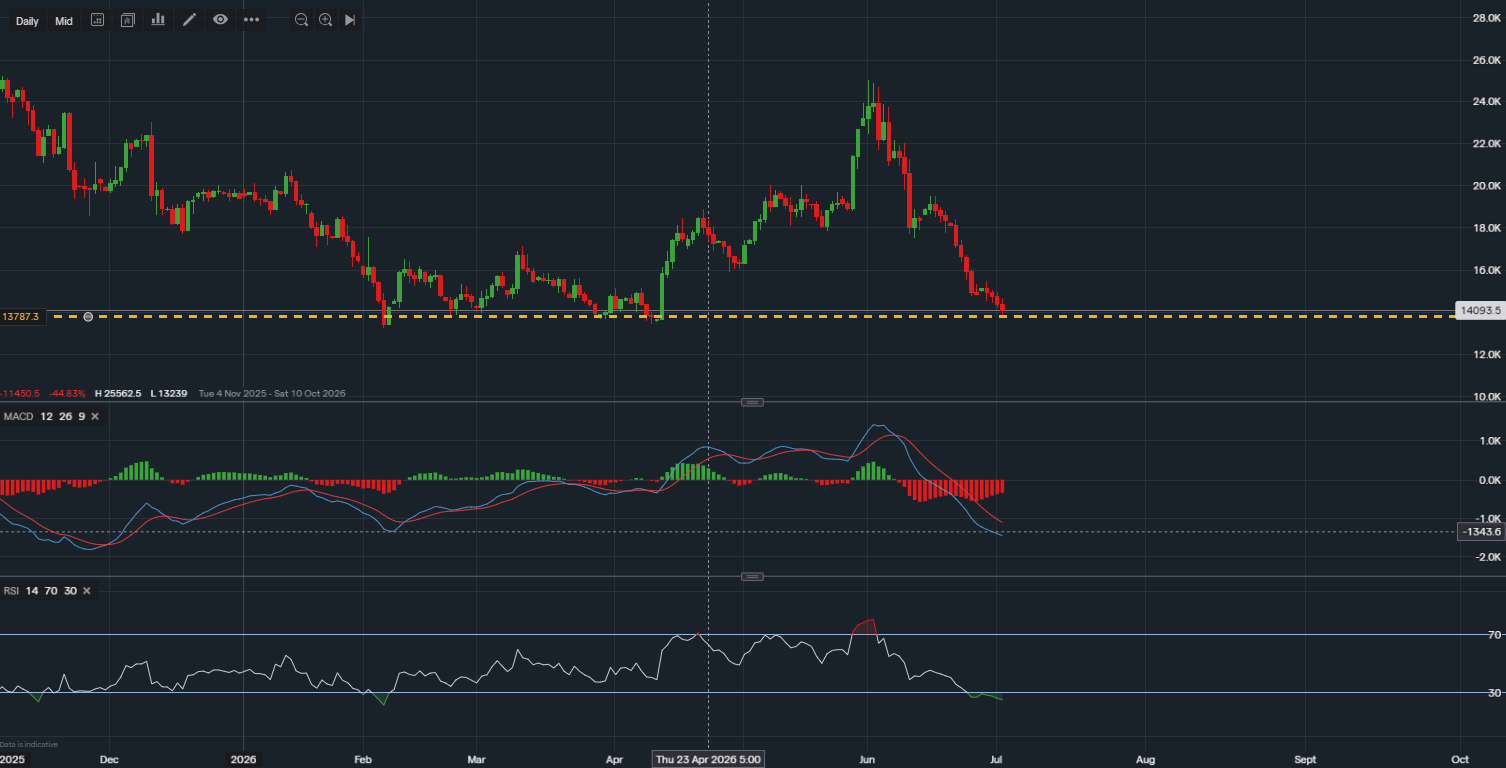
$140.94
05 Jul 2026, 08:55
Bullish

Join Minipip Academy and access free courses in investing, trading, economics, and more.
Sign Up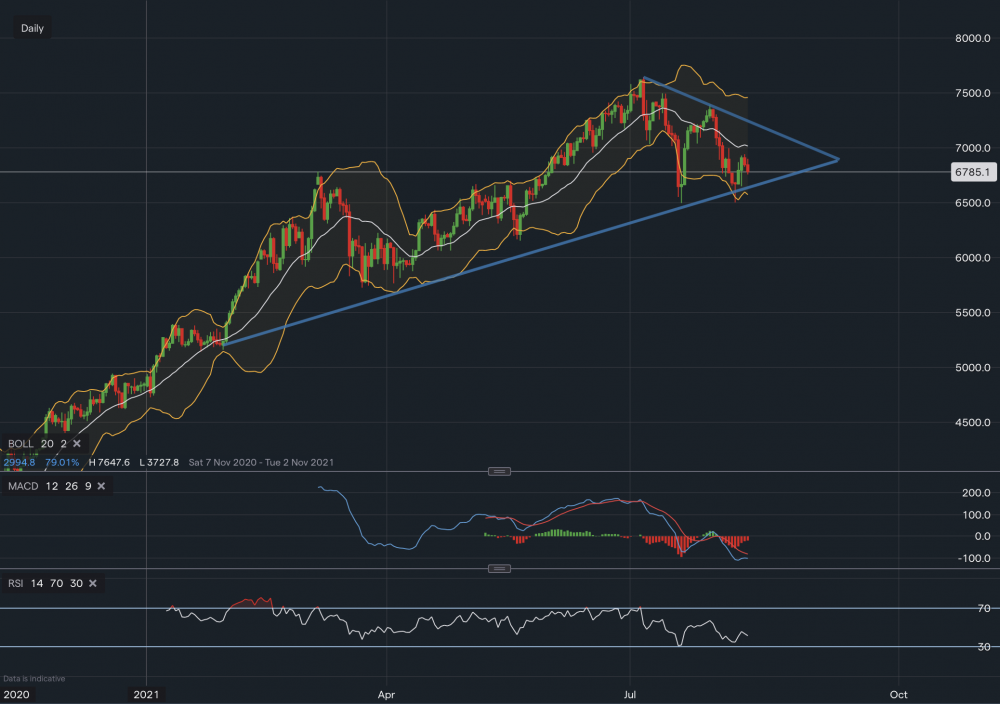
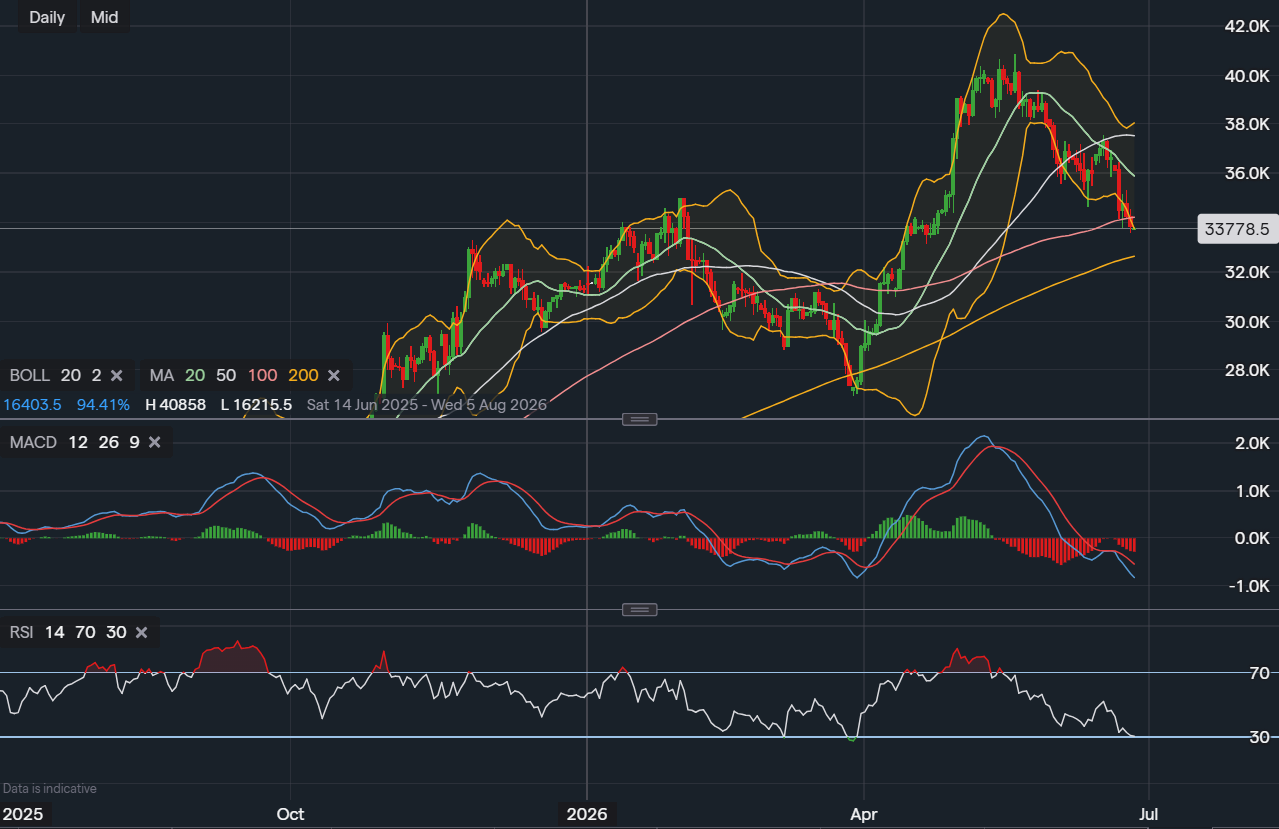
Oil has rallied tremendously from the April lows and currently sits between the 50% - 61.8% Fibonacci. This means initial support does sit at 50% or $36.56 followed by further support at the lower Bollinger band $33.84. The first targets being $40.36 which is the upper Bollinger band, followed by $43.38 which is the 61.8% Fibonacci. MACD is trending lower but does show positive momentum possibly creeping up and turning positive in the coming days helping accelerate to the initial targets.
 Earnings Calendar
  Economic Calendar
  VAT Calculator
  Tax Free Childcare Calculator
 Percentage Calculator
 Compound Interest Calculator
  Loan Overpayment Calculator
 Mortgage Calculator
 Credit Card Calculator
 Investing
  Economics
 Trading
  Technical Analysis
  Personal Finance
 Calculator