Visa (NYSE:) Technical Analysis: Earnings in Focus as Bullish Momentum Builds
$364.68
28 Jul 2026, 15:59
Neutral

Join Minipip Academy and access free courses in investing, trading, economics, and more.
Sign Up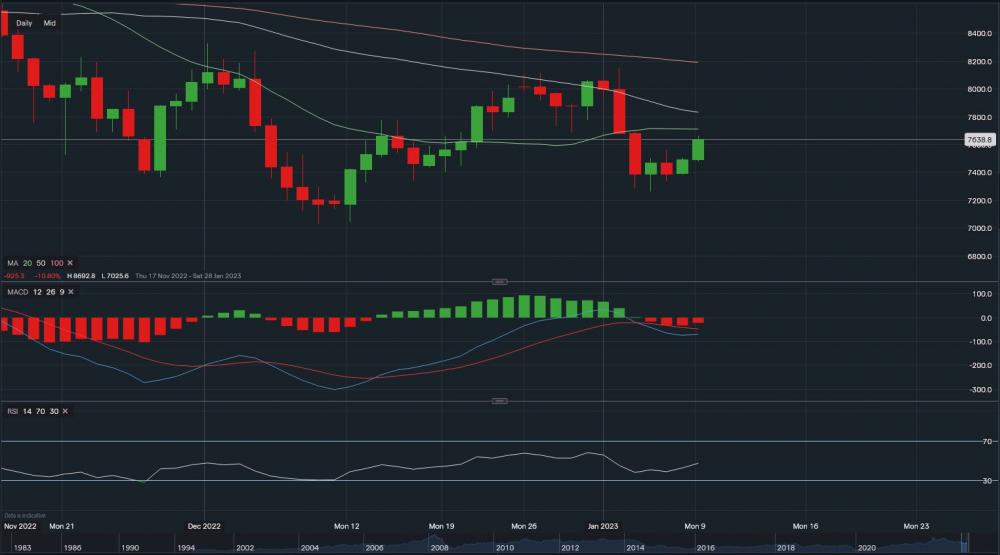
Crude Oil - Chart & Data from IG
US Crude Oil is currently trading at $76.38 a barrel. Prior to Christmas, the price of oil fell as low as $70.25 from the high of $121 back in June 2022. From a technical aspect, support below sits at $75.06 then at $74.36 then at $73.40. A break below the $73.40 price level could see the price of oil head back down towards the $70 a barrel price level. However, towards the upside, resistance sits at $77.11 (green 20-day moving average) followed by $78.32 (white 50-day moving average). A break above the 50-day moving average may see the price climb towards the $80 mark. China's reopening of borders lifted fuel demand outlook slightly offset concerns of a global recession. Additionally, China's crude oil import permissions raised hopes that Chinese buyers would boost crude purchases. Looking at the technical indicators, MACD is negative but slightly curving towards the neutral position and RSI is neutral as it reads 47.
 Earnings Calendar
  Economic Calendar
  VAT Calculator
  Tax Free Childcare Calculator
 Percentage Calculator
 Compound Interest Calculator
  Loan Overpayment Calculator
 Mortgage Calculator
 Credit Card Calculator
 Investing
  Economics
 Trading
  Technical Analysis
  Personal Finance
 Calculator


